
Dashboard
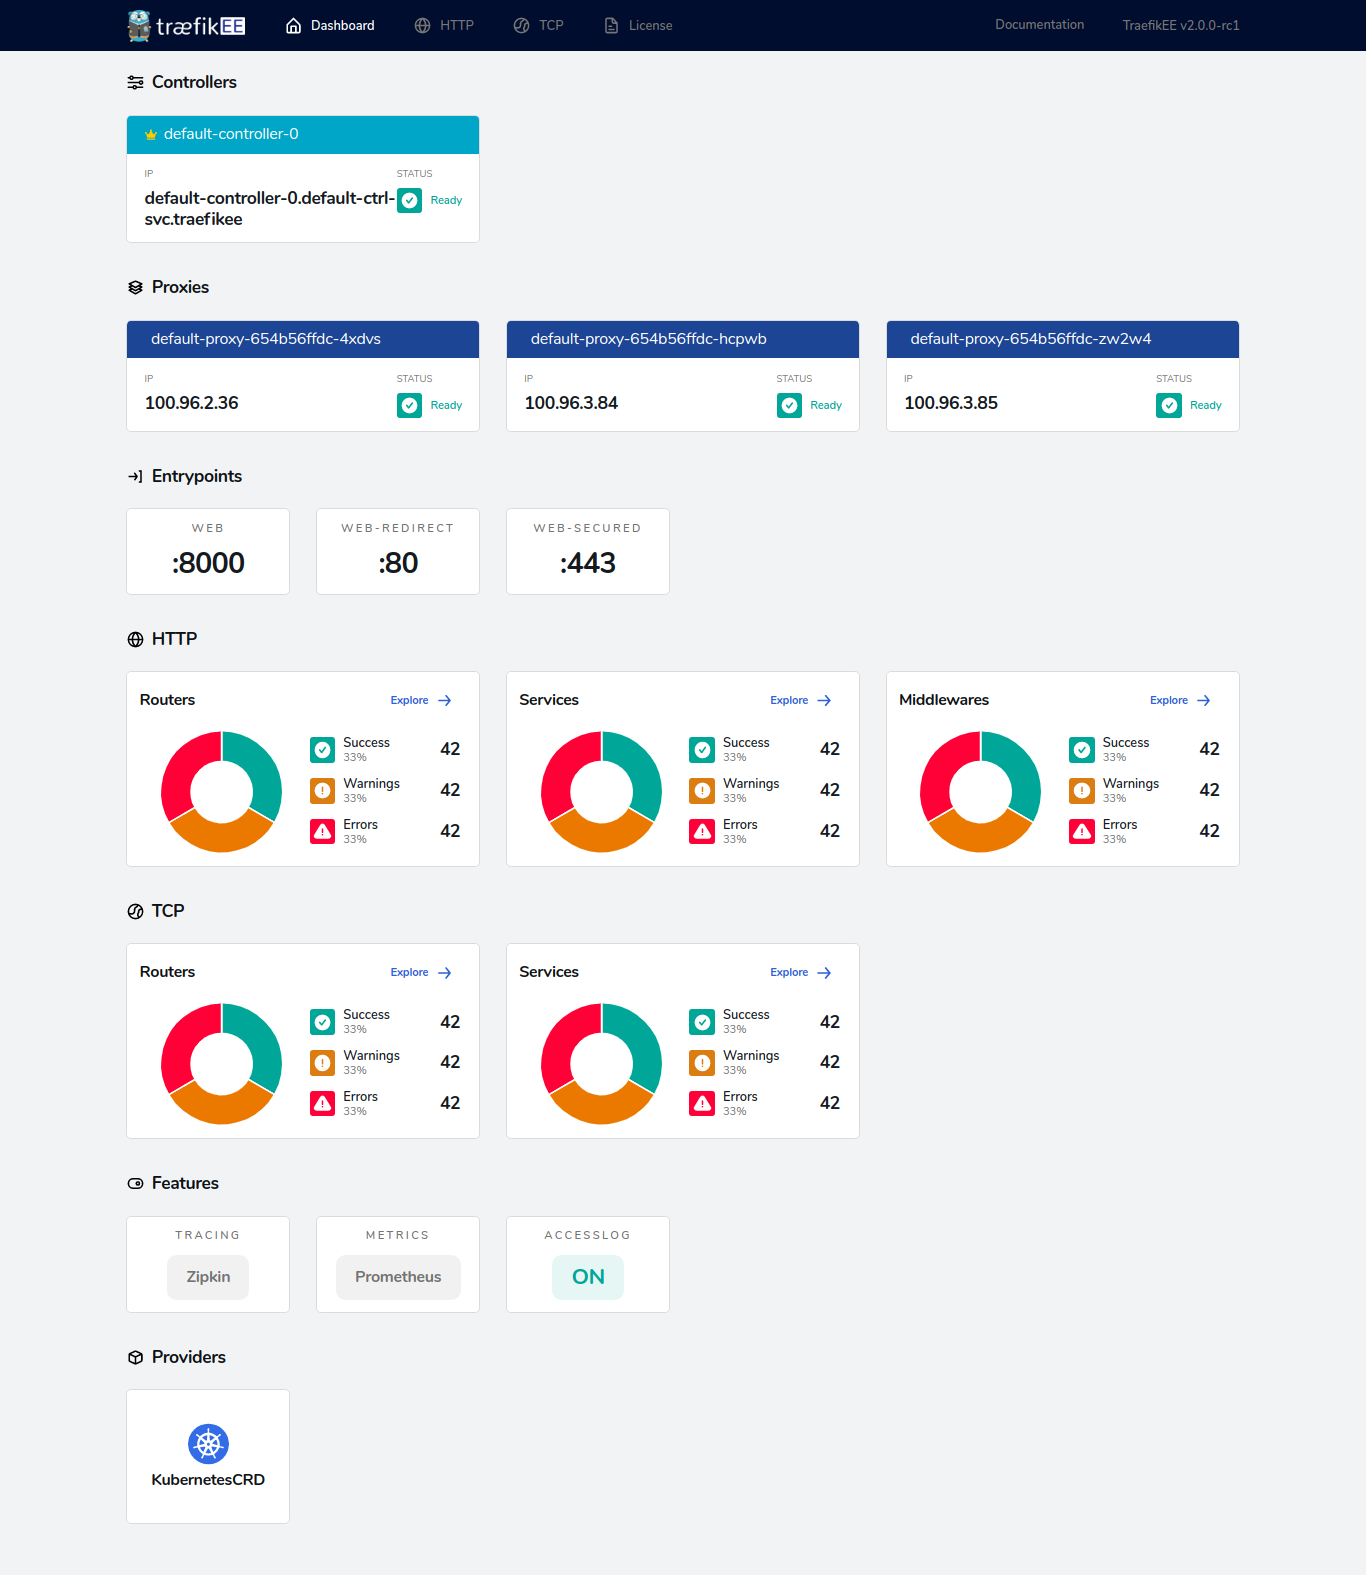
TraefikEE comes with a handy dashboard that provides a detailed overview of the current status of your cluster.
This includes all the current routes being handled by the cluster, but also its status and license information.
Enabling the Dashboard
Where is the dashboard served?
The dashboard is served by the proxies.
The dashboard behaves as a service called api@internal, so it is possible to leverage all of Traefik's routing capabilities to build the most suited configuration.
Its behavior is close from the Traefik dashboard, for a more in depth explanation please refer to the Traefik documentation.
Example
This example shows how to enable the dashboard on the port 8888 and the domain traefikee.domain.org with basic authentication enabled.
To do so, create a router called api through the dynamic configuration which routes all requests coming through the internal entrypoint to the api@internal service.
In our case, the entrypoint internal is listening to the address :8888.
Also, in order to protect this from the rest of the internet, set up a basic authentication middleware on this router.
First, the applied static configuration should contain the following elements:
# [...]
[entryPoints]
  # [...]
  [entryPoints.internal]
    address = ":8888"

[api]
dashboard = true# [...]
entrypoints:
# [...]
internal:
address: ":8888"
api:
dashboard: trueThen provide the following routing configuration according to the enabled provider
# important: This configuration is a partial example, used to highlight the ports and labels sections.
---
# [...]
services:
  proxies:
    image: "store/containous/traefikee:v2.0"
    deploy:
      # [...]
      labels:
        # This label is required by TraefikEE, please keep it.
        com.containous.traefikee.component: proxies
        # Here is the the routing configuration.
        traefik.http.routers.dashboard.rule: "Host(`traefikee.domain.org`)"
        traefik.http.routers.dashboard.service: "api@internal"
        traefik.http.routers.dashboard.entrypoints: "internal"
        traefik.http.routers.api.middlewares: "auth"
        traefik.http.middlewares.auth.basicauth.users: "test:$$apr1$$H6uskkkW$$IgXLP6ewTrSuBkTrqE8wj/,test2:$$apr1$$d9hr9HBB$$4HxwgUir3HP4EsggP/QNo0"
        # Dummy service for Swarm port detection. The port can be any valid integer value.
        traefik.http.services.dummy-svc.loadbalancer.server.port: "9999"
    ports:
      # [...]
      # Expose the port 8888 to the swarm ingress network so the API can be reached from outside
      - 8888:8888
# important: Don't forget to expose the port 8888 of your proxies through
# a kubernetes service to make the API is reachable from outside.
---
apiVersion: traefik.containo.us/v1alpha1
kind: IngressRoute
metadata:
  name: api
spec:
  entryPoints:
    - internal
  routes:
  - match: Host(`traefikee.domain.org`)
    kind: Rule
    middlewares:
    - name: auth
    services:
    - name: api@internal
      kind: TraefikService
---
apiVersion: traefik.containo.us/v1alpha1
kind: Middleware
metadata:
  name: auth
spec:
  basicAuth:
secret: secretName # secrets where is stored the basic auth credentials.[http.routers.api]
rule = "Host(`traefikee.domain.org`)"
service = "api@internal"
middlewares = ["auth"]
entryPoints = ["internal"]
[http.middlewares.auth.basicAuth]
users = [
"test:$apr1$H6uskkkW$IgXLP6ewTrSuBkTrqE8wj/",
]---
http:
routers:
api:
rule: Host(`traefikee.domain.org`)
service: api@internal
entryPoints:
- internal
middlewares:
- auth
middlewares:
auth:
basicAuth:
users:
- "test:$apr1$H6uskkkW$IgXLP6ewTrSuBkTrqE8wj/"