Web Backend
Træfik can be configured:
- using a RESTful api.
- to use a monitoring system (like Prometheus, DataDog or StatD, ...).
- to expose a Web Dashboard.
Configuration
# Enable web backend.
[web]

# Web administration port.
#
# Required
# Default: ":8080"
#
address = ":8080"

# SSL certificate and key used.
#
# Optional
#
# certFile = "traefik.crt"
# keyFile = "traefik.key"

# Set REST API to read-only mode.
#
# Optional
# Default: false
#
readOnly = true
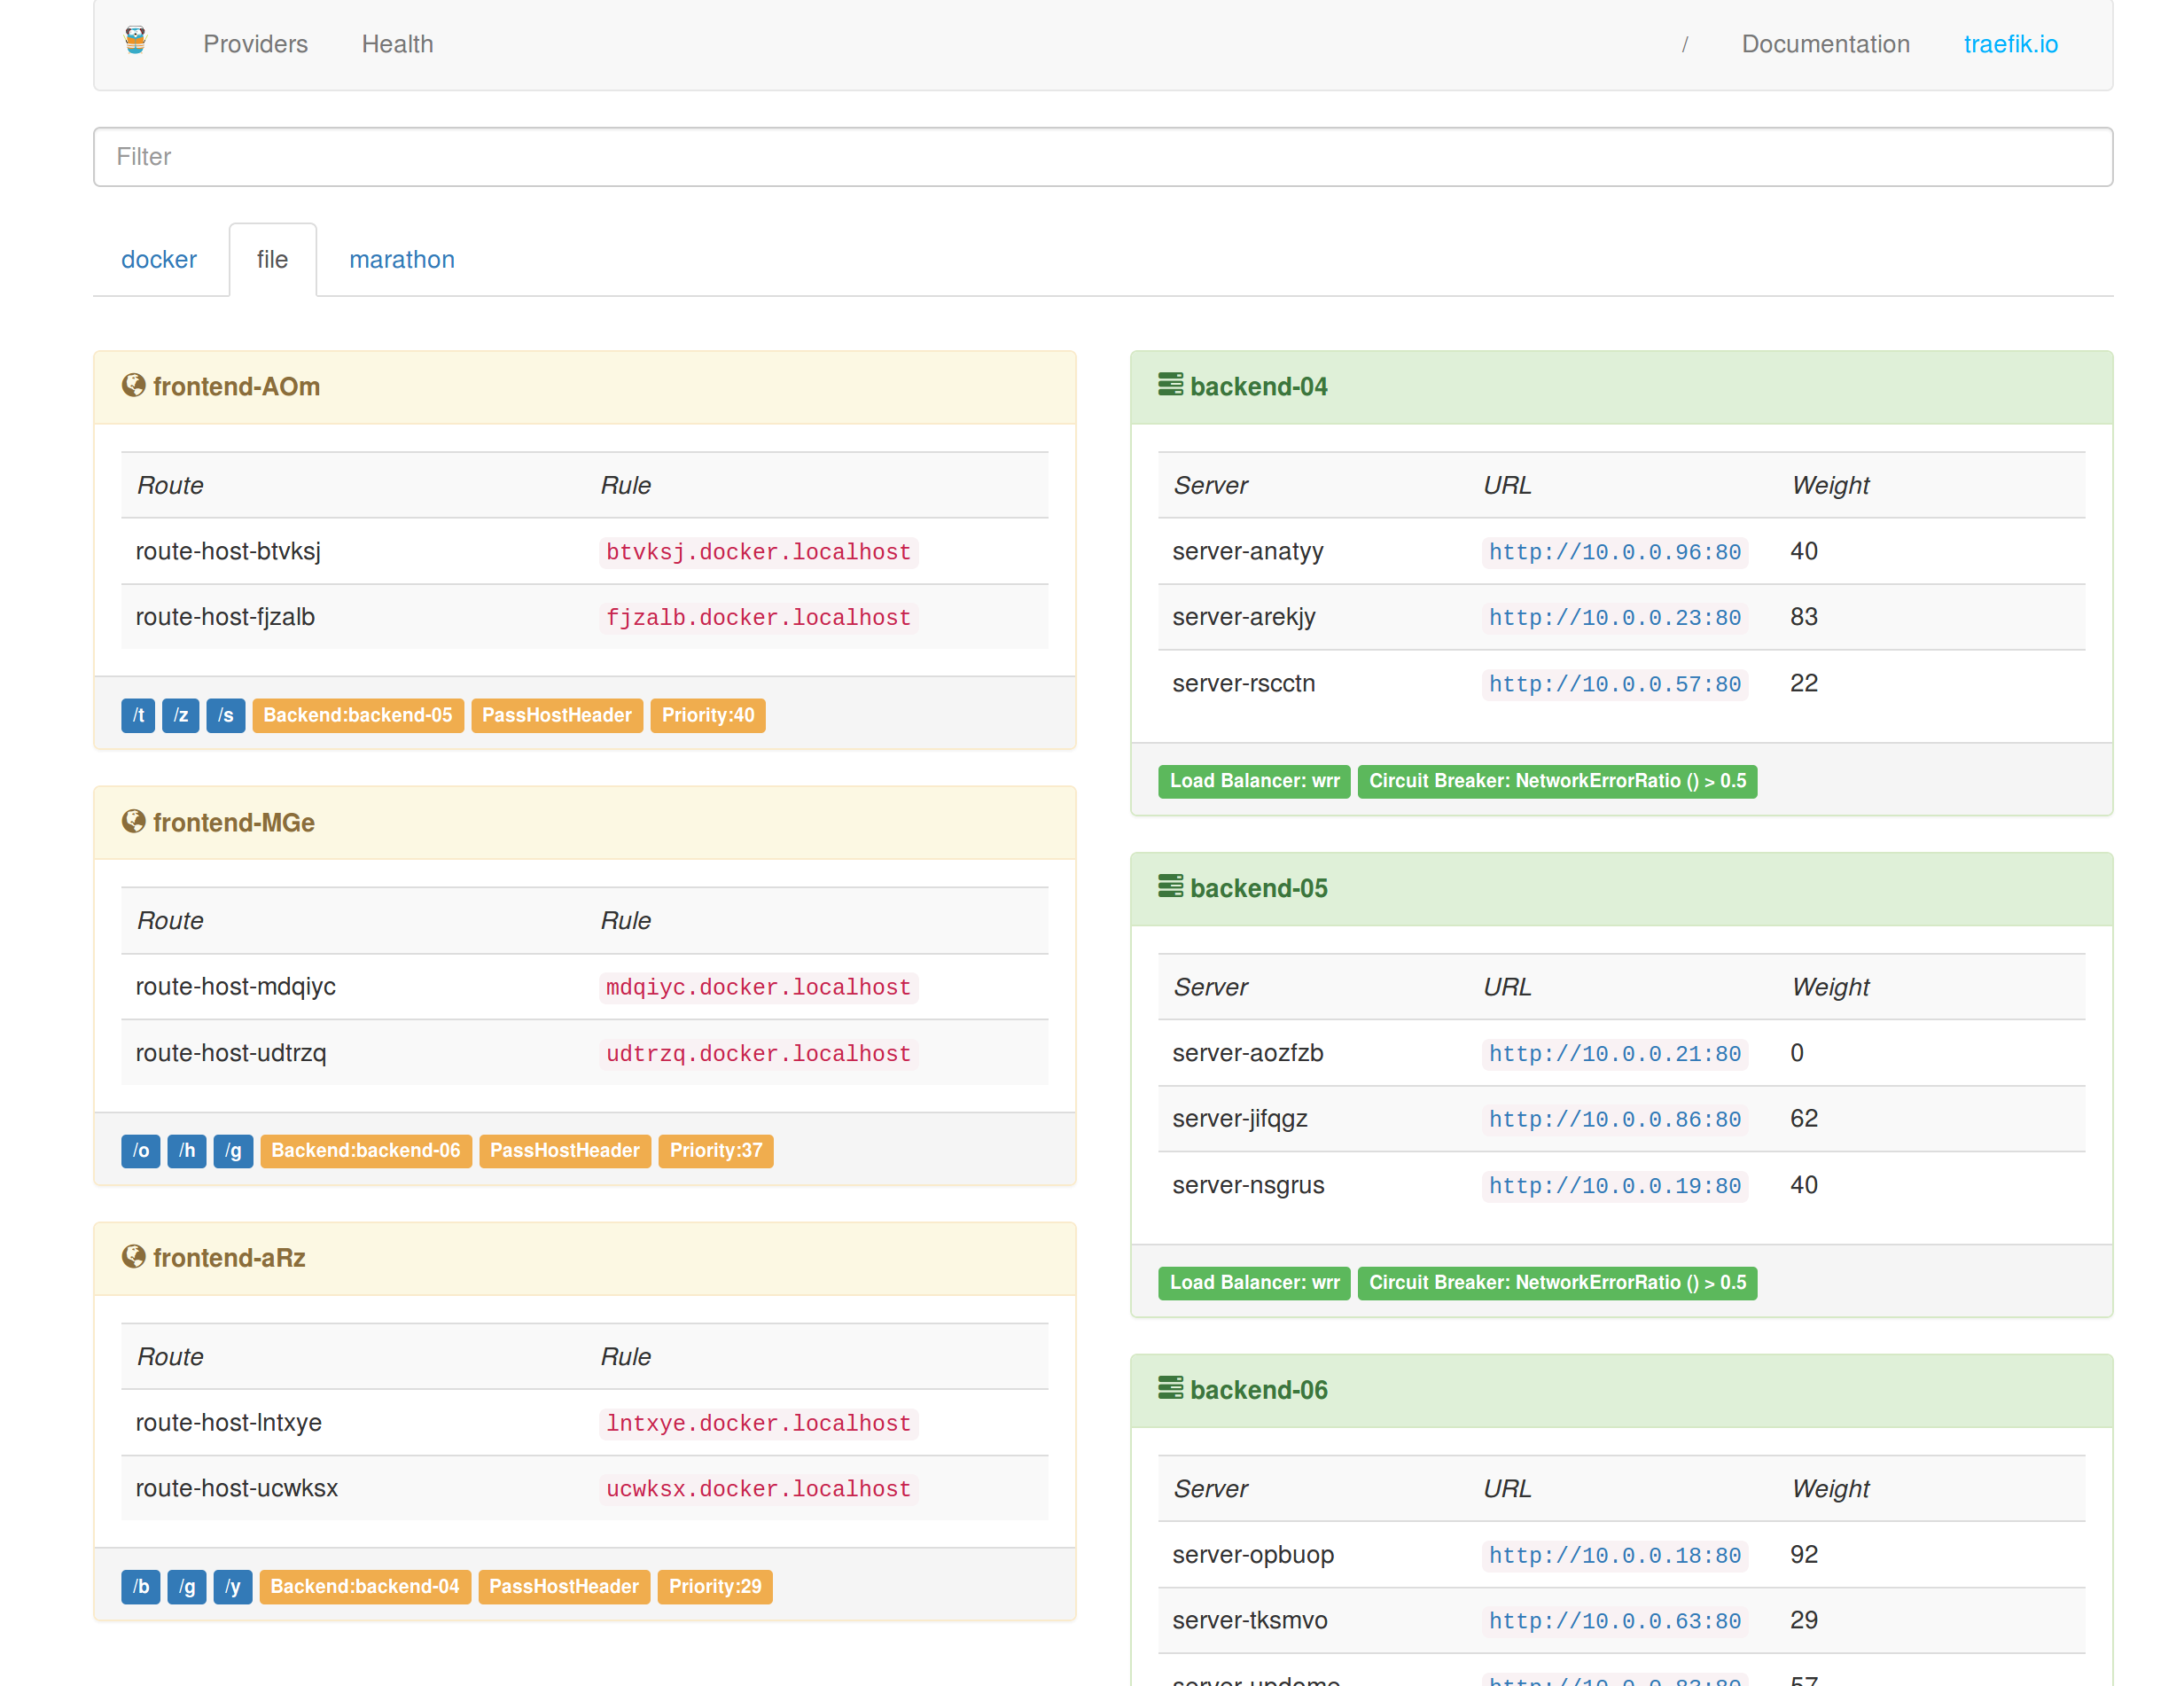
Web UI
Authentication
Note
The /ping path of the api is excluded from authentication (since 1.4).
Basic Authentication
Passwords can be encoded in MD5, SHA1 and BCrypt: you can use htpasswd to generate those ones.
Users can be specified directly in the toml file, or indirectly by referencing an external file; if both are provided, the two are merged, with external file contents having precedence.
[web]
# ...

# To enable basic auth on the webui with 2 user/pass: test:test and test2:test2
[web.auth.basic]
users = ["test:$apr1$H6uskkkW$IgXLP6ewTrSuBkTrqE8wj/", "test2:$apr1$d9hr9HBB$4HxwgUir3HP4EsggP/QNo0"]
usersFile = "/path/to/.htpasswd"

# ...
Digest Authentication
You can use htdigest to generate those ones.
Users can be specified directly in the toml file, or indirectly by referencing an external file; if both are provided, the two are merged, with external file contents having precedence
[web]
# ...

# To enable digest auth on the webui with 2 user/realm/pass: test:traefik:test and test2:traefik:test2
[web.auth.digest]
users = ["test:traefik:a2688e031edb4be6a3797f3882655c05 ", "test2:traefik:518845800f9e2bfb1f1f740ec24f074e"]
usersFile = "/path/to/.htdigest"

# ...
Metrics
You can enable Traefik to export internal metrics to different monitoring systems.
Prometheus
[web]
# ...

# To enable Traefik to export internal metrics to Prometheus
[web.metrics.prometheus]

# Buckets for latency metrics
#
# Optional
# Default: [0.1, 0.3, 1.2, 5]
buckets=[0.1,0.3,1.2,5.0]

# ...
DataDog
[web]
# ...

# DataDog metrics exporter type
[web.metrics.datadog]

# DataDog's address.
#
# Required
# Default: "localhost:8125"
#
address = "localhost:8125"

# DataDog push interval
#
# Optional
# Default: "10s"
#
pushinterval = "10s"

# ...
StatsD
[web]
# ...

# StatsD metrics exporter type
[web.metrics.statsd]

# StatD's address.
#
# Required
# Default: "localhost:8125"
#
address = "localhost:8125"

# StatD push interval
#
# Optional
# Default: "10s"
#
pushinterval = "10s"

# ...
Statistics
[web]
# ...

# Enable more detailed statistics.
[web.statistics]

# Number of recent errors logged.
#
# Default: 10
#
recentErrors = 10

# ...
API
| Path | Method | Description |
|---|---|---|
/ |
GET |
Provides a simple HTML frontend of Træfik |
/ping |
GET, HEAD |
A simple endpoint to check for Træfik process liveness. Return a code 200 with the content: OK |
/health |
GET |
json health metrics |
/api |
GET |
Configuration for all providers |
/api/providers |
GET |
Providers |
/api/providers/{provider} |
GET, PUT |
Get or update provider |
/api/providers/{provider}/backends |
GET |
List backends |
/api/providers/{provider}/backends/{backend} |
GET |
Get backend |
/api/providers/{provider}/backends/{backend}/servers |
GET |
List servers in backend |
/api/providers/{provider}/backends/{backend}/servers/{server} |
GET |
Get a server in a backend |
/api/providers/{provider}/frontends |
GET |
List frontends |
/api/providers/{provider}/frontends/{frontend} |
GET |
Get a frontend |
/api/providers/{provider}/frontends/{frontend}/routes |
GET |
List routes in a frontend |
/api/providers/{provider}/frontends/{frontend}/routes/{route} |
GET |
Get a route in a frontend |
/metrics |
GET |
Export internal metrics |
Example
Ping
curl -sv "http://localhost:8080/ping"
*   Trying ::1...
* Connected to localhost (::1) port 8080 (#0)
> GET /ping HTTP/1.1
> Host: localhost:8080
> User-Agent: curl/7.43.0
> Accept: */*
>
< HTTP/1.1 200 OK
< Date: Thu, 25 Aug 2016 01:35:36 GMT
< Content-Length: 2
< Content-Type: text/plain; charset=utf-8
<
* Connection #0 to host localhost left intact
OK
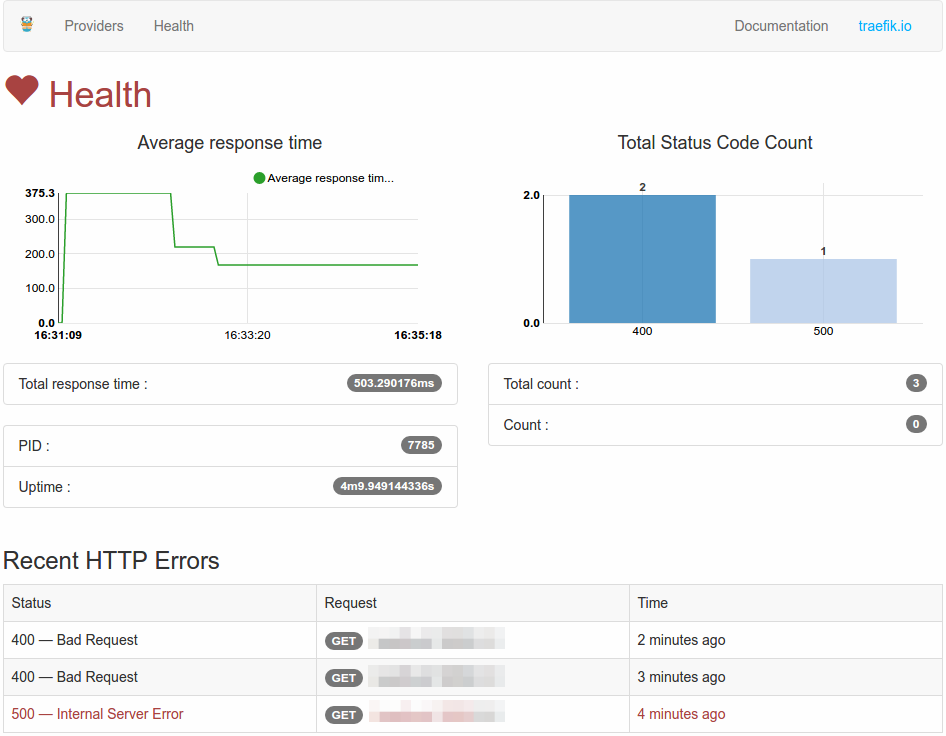
Health
curl -s "http://localhost:8080/health" | jq .
{
  // Træfik PID
  "pid": 2458,
  // Træfik server uptime (formated time)
  "uptime": "39m6.885931127s",
  //  Træfik server uptime in seconds
  "uptime_sec": 2346.885931127,
  // current server date
  "time": "2015-10-07 18:32:24.362238909 +0200 CEST",
  // current server date in seconds
  "unixtime": 1444235544,
  // count HTTP response status code in realtime
  "status_code_count": {
    "502": 1
  },
  // count HTTP response status code since Træfik started
  "total_status_code_count": {
    "200": 7,
    "404": 21,
    "502": 13
  },
  // count HTTP response
  "count": 1,
  // count HTTP response
  "total_count": 41,
  // sum of all response time (formated time)
  "total_response_time": "35.456865605s",
  // sum of all response time in seconds
  "total_response_time_sec": 35.456865605,
  // average response time (formated time)
  "average_response_time": "864.8016ms",
  // average response time in seconds
  "average_response_time_sec": 0.8648016000000001,

  // request statistics [requires --web.statistics to be set]
  // ten most recent requests with 4xx and 5xx status codes
  "recent_errors": [
    {
      // status code
      "status_code": 500,
      // description of status code
      "status": "Internal Server Error",
      // request HTTP method
      "method": "GET",
      // request hostname
      "host": "localhost",
      // request path
      "path": "/path",
      // RFC 3339 formatted date/time
      "time": "2016-10-21T16:59:15.418495872-07:00"
    }
  ]
}
Provider configurations
curl -s "http://localhost:8080/api" | jq .
{
  "file": {
    "frontends": {
      "frontend2": {
        "routes": {
          "test_2": {
            "rule": "Path:/test"
          }
        },
        "backend": "backend1"
      },
      "frontend1": {
        "routes": {
          "test_1": {
            "rule": "Host:test.localhost"
          }
        },
        "backend": "backend2"
      }
    },
    "backends": {
      "backend2": {
        "loadBalancer": {
          "method": "drr"
        },
        "servers": {
          "server2": {
            "weight": 2,
            "URL": "http://172.17.0.5:80"
          },
          "server1": {
            "weight": 1,
            "url": "http://172.17.0.4:80"
          }
        }
      },
      "backend1": {
        "loadBalancer": {
          "method": "wrr"
        },
        "circuitBreaker": {
          "expression": "NetworkErrorRatio() > 0.5"
        },
        "servers": {
          "server2": {
            "weight": 1,
            "url": "http://172.17.0.3:80"
          },
          "server1": {
            "weight": 10,
            "url": "http://172.17.0.2:80"
          }
        }
      }
    }
  }
}