Features
High Availability
The control plane is a key component of TraefikEE. It is responsible for storing all cluster data, including events, TLS certificates, and the Traefik configuration. It is also in charge of connecting to the orchestrator to generate the data plane routing configuration.
Since it is such a critical part of your system, TraefikEE is designed from the ground up to be fault tolerant: the control plane runs natively in cluster mode without any extra configuration or external key-value store. It ensures your data is always available and safe by using an internal distributed store, implemented with raft.
You can find more information on high availability by visiting "Concepts" -> "High availability".
Scalability
The data plane is in charge of forwarding the incoming requests to the backend applications running inside your infrastructure. It is designed to scale horizontally in order to face irregular network loads. TraefikEE handles high loads easily: just add more nodes to the data plane to handle the additional requests. When the peak is gone, shrink the number of nodes to save resources. Of course, this process can be done automatically using auto-scaling tools.
Security
By splitting responsibilities between two planes, TraefikEE follows the principle of "Separation of Concerns". To ensure that sensitive information only runs on a closed and safe environment, the control plane is not exposed to the outside. As a result, any malicious action from external traffic will remain contained within the data plane and your platform will stay safe. Moreover, TraefikEE only relies on encrypted communications between nodes, to add an extra layer of security.
Smooth Operations
Installing and managing a raft-based application is usually a painful experience. Since Traefik became popular thanks to its usability and refreshing user experience, we have extended those benefits for you to TraefikEE.
TraefikEE comes with an additional CLI for deploying and operating clusters with several nodes in only one command line.
We hope you will love using teectl (pronounced “tea-cuddle”), a time-saving tool.
Dashboard
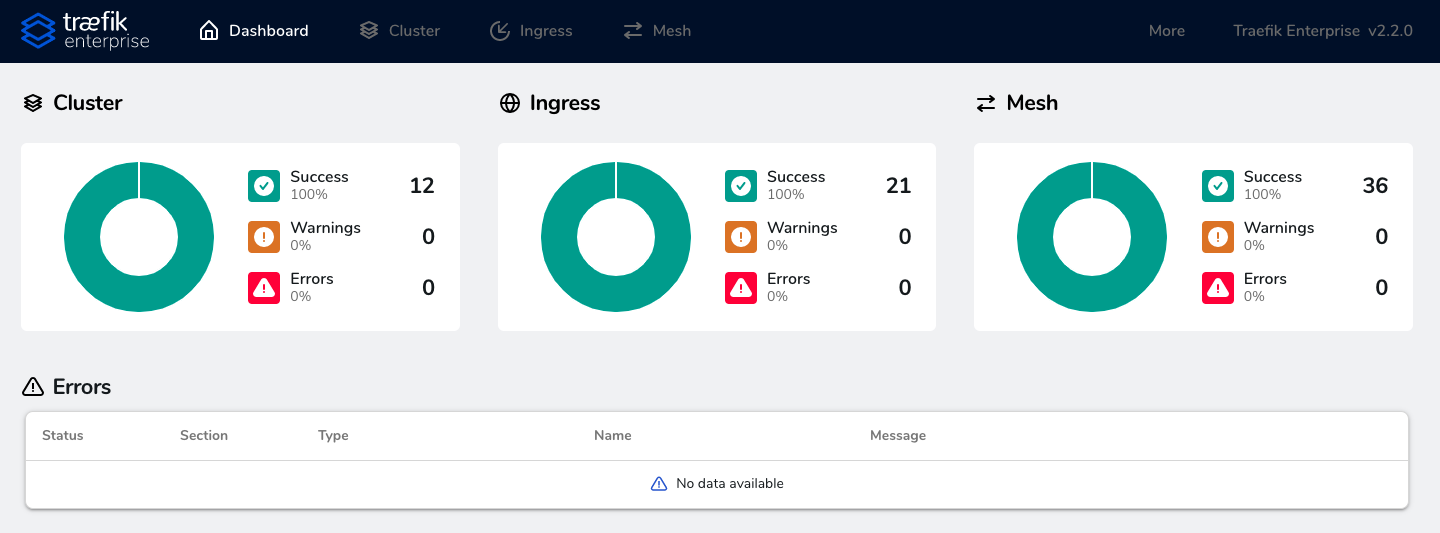
The TraefikEE dashboard shows you all the relevant information about your cluster at a glance.
- Visualize the nodes of your cluster, routing information, providers and enabled features:

- Get an overview of your routing rules per protocol:

- See detailed information on your routers:

Support
TraefikEE licenses come with built-in support: contact our team of engineers at support.containo.us.
Compare
| Feature | Traefik | TraefikEE |
|---|---|---|
| Websockets, HTTP/2, TCP, GRPC ready | ✓ | ✓ |
| Dynamic Configuration | ✓ | ✓ |
| Metrics | ✓ | ✓ |
| Tracing | ✓ | ✓ |
| Let's Encrypt | ✓ | ✓ |
| LDAP Authentication | ✓ | |
| JWT Authentication | ✓ | |
| HMAC Authentication | ✓ | |
| OAuth Token Introspection | ✓ | |
| Distributed Let's Encrypt | ✓ | |
| Distributed Rate Limit | ✓ | |
| Distributed In Flight Request | ✓ | |
| High Availability | ✓ | |
| Encrypted Cluster Communication | ✓ | |
| Built-In Commercial Support | ✓ | |
| Cluster-Wide Dashboard | ✓ | |
| Remote CLI | ✓ |
What's Next?
Now that you have a basic overview of TraefikEE's features, you might want to go straight to the installation phase and read the Quick Start.
Or maybe you'd like to familiarize yourself even more with the vocabulary and take a look at the glossary?
