Dashboard
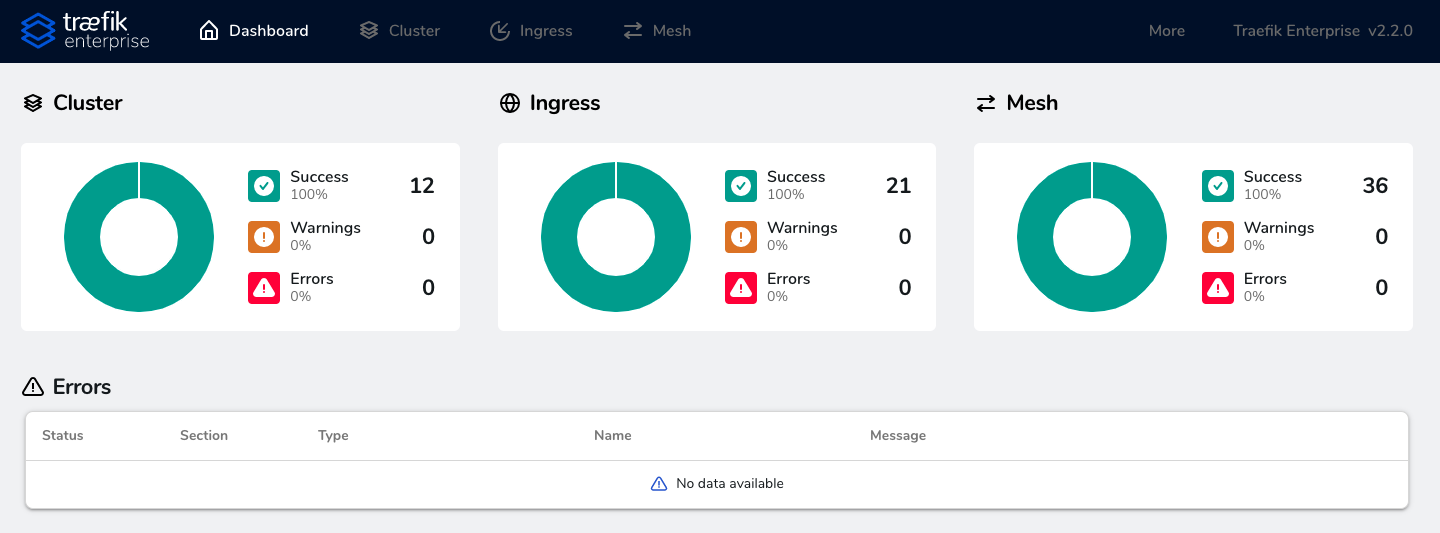
Traefik Enterprise comes with a handy dashboard that provides a detailed overview of the current status of your cluster, including detailed information on your cluster's ingress and service mesh routing configuration.
Enabling the Dashboard
Where is the dashboard served?
Ingress proxies serve the dashboard.
An internal service called api@internal serves the dashboard, which makes it possible to leverage all of Traefik Proxy's routing capabilities to build the most suitable configuration.
It works similarly to the Traefik Proxy dashboard. For a more in-depth explanation, please refer to the Traefik Proxy documentation.
Example
This example shows how to enable the dashboard on the port 8888 and the domain traefikee.domain.org with basic authentication enabled.
To do so, create a router called api through the dynamic configuration which routes all requests coming through the internal entrypoint to the api@internal service.
In our case, the entrypoint internal is listening to the address :8888.
Also, in order to protect this from the rest of the internet, set up a basic authentication middleware on this router.
First, the applied static configuration should contain the following elements:
# [...]
entrypoints:
  # [...]
  internal:
    address: ":8888"

api:
dashboard: true# [...]
[entryPoints]
# [...]
[entryPoints.internal]
address = ":8888"
[api]
dashboard = trueThen, apply the following dynamic configuration:
---
http:
  routers:
    api:
      rule: Host(`traefikee.domain.org`)
      service: api@internal
      entryPoints:
        - internal
      middlewares:
        - auth
  middlewares:
    auth:
      basicAuth:
        users:
- "test:$apr1$H6uskkkW$IgXLP6ewTrSuBkTrqE8wj/"[http.routers.api]
rule = "Host(`traefikee.domain.org`)"
service = "api@internal"
middlewares = ["auth"]
entryPoints = ["internal"]
[http.middlewares.auth.basicAuth]
users = [
"test:$apr1$H6uskkkW$IgXLP6ewTrSuBkTrqE8wj/",
]Using the teectl apply command:
teectl apply --file=dynamic.yamlteectl apply --file=dynamic.toml