Track AI Inference Costs by Team
Traefik Hub AI Gateway emits OpenTelemetry GenAI metrics for every LLM request. These metrics include input and output token counts, model identity, and the application that made the request. You can use these signals to attribute inference costs to teams, visualize spending trends in Grafana, alert before a team exhausts its monthly budget, and enforce hard caps with the Token Rate Limit middleware.
This guide walks through a fictive organization with three teams (Engineering, Marketing, and Data Science) and a shared OpenAI endpoint. By the end, each team's token spend is visible in a Grafana dashboard and an alert triggers when any team reaches 90% of its monthly allowance.
Prerequisites
- AI Gateway enabled on your cluster
- At least one AI middleware deployed: Chat Completion, Responses API, or Messages API
- Metrics flowing from Traefik Hub to Prometheus, either through an OTel Collector receiving the OTLP push
(
metrics.otlp) and remote-writing to Prometheus, or via direct Prometheus scraping (metrics.prometheus). See the metrics reference - Grafana connected to that Prometheus data source
- API Management enabled (provides the
app_*attribution labels)
How cost attribution works
Every AI middleware emits gen_ai.client.token.usage, an OpenTelemetry histogram of input and output tokens per
response, once observability.metrics.level: detailed is set (see Monitor Token Usage).
It carries these attributes:
| Attribute | Description | Example |
|---|---|---|
app_name | Application name from API Management | engineering, marketing |
app_id | Application ID from API Management | app-abc123 |
gen_ai.response.model | Model used by the upstream provider | gpt-4o |
gen_ai.token.type | Token category | input, output |
The app_name label is set by API Management from the API key's application metadata.
Each team registers its own application in the API Portal; the gateway stamps every request automatically.
This guide uses the OpenTelemetry attribute names (gen_ai.response.model, gen_ai.token.type) when referring to
the metric itself. Once it reaches Prometheus, whether scraped directly or remote-written from an OTel Collector,
dots become underscores and the histogram is queried as gen_ai_client_token_usage. Use the _sum suffix to query
cumulative token counts (gen_ai_client_token_usage_sum). The PromQL examples below use this Prometheus-flattened name.
Step 1: Tag traffic by team
Configure observability.metrics on each AI middleware to include the app_name and app_id attribution labels and
set level: detailed, required for gen_ai.client.token.usage (or any GenAI metric) to be emitted.
The example below uses the Chat Completion middleware; the same block applies to Responses API and Messages API.
apiVersion: traefik.io/v1alpha1
kind: Middleware
metadata:
  name: openai-chat
  namespace: apps
spec:
  plugin:
    chat-completion:
      token: urn:k8s:secret:ai-keys:openai-token
      model: gpt-4o
      observability:
        metrics:
          level: detailed
          addLabels:
            - app_id
            - app_name
All teams share a single route and the same openai-chat middleware instance. The app_name/app_id labels come
from each team's API Management application key, not from routing, so no per-team routing is needed yet.
Per-team routing becomes necessary in Step 5 where enforcing a separate quota per team requires a distinct
middleware and a distinct route.
apiVersion: traefik.io/v1alpha1
kind: IngressRoute
metadata:
  name: ai-api
  namespace: apps
spec:
  entryPoints: [websecure]
  routes:
    - match: Host(`ai.example.com`)
      kind: Rule
      middlewares:
        - name: openai-chat
      services:
        - name: openai-proxy
          port: 443
After a few requests, confirm labels are flowing in Prometheus:
gen_ai_client_token_usage_sum{app_name=~".+"}
Step 2: Estimate cost
Traefik Hub already emits gen_ai.client.operation.cost, a histogram of estimated cost in US
dollars, once metrics.level: detailed is set (already done in Step 1). Query it directly for a
per-team total:
sum by (app_name) (gen_ai_client_operation_cost_sum)
If that's enough, skip to Step 3. Use the rest of this step instead if
you need either of the following, which gen_ai.client.operation.cost doesn't provide:
- A cost broken down by input compared to output tokens.
gen_ai.client.operation.costreports one combined amount per request.gen_ai.client.token.usage, which this step prices, separates input and output token counts, so you can apply a different rate to each. - Pricing from your own rates instead of Hub's bundled price list.
gen_ai.client.operation.costalways prices against Hub's bundled model price list. This step lets you plug in your own price constants, for example a negotiated or discounted rate your provider gives you.
Token counts are the universal fundamental metric, as model pricing and exchange rates are subject to change. Apply a price per token per model to convert the raw token counts from Step 1 into a currency-based cost estimate. The prices below are illustrative. Update them whenever your provider changes rates.
Apply this multiplication upstream, in the OTel Collector pipeline, or downstream, in a Prometheus recording rule. Pick based on where your metrics already flow through.
- OTel Collector
- Prometheus recording rule
If an OTel Collector already receives Traefik Hub's metrics over OTLP (see Prerequisites), add a
transform processor that rewrites each histogram's sum field to a cost in USD, before the metrics reach
Prometheus. This keeps the pricing logic in a single place, upstream of every dashboard and alert.
receivers:
  otlp:
    protocols:
      grpc:

processors:
  batch:
  transform/ai_cost:
    metric_statements:
      - context: datapoint
        statements:
          - set(datapoint.sum, datapoint.sum * 0.0025 / 1000) where datapoint.attributes["gen_ai.response.model"] == "gpt-4o" and datapoint.attributes["gen_ai.token.type"] == "input"
          - set(datapoint.sum, datapoint.sum * 0.01 / 1000) where datapoint.attributes["gen_ai.response.model"] == "gpt-4o" and datapoint.attributes["gen_ai.token.type"] == "output"
          - set(datapoint.sum, datapoint.sum * 0.00015 / 1000) where datapoint.attributes["gen_ai.response.model"] == "gpt-4o-mini" and datapoint.attributes["gen_ai.token.type"] == "input"
          - set(datapoint.sum, datapoint.sum * 0.0006 / 1000) where datapoint.attributes["gen_ai.response.model"] == "gpt-4o-mini" and datapoint.attributes["gen_ai.token.type"] == "output"

exporters:
  prometheusremotewrite:
    endpoint: http://prometheus.monitoring.svc.cluster.local:9090/api/v1/write

service:
  pipelines:
    metrics:
      receivers: [otlp]
      processors: [transform/ai_cost, batch]
      exporters: [prometheusremotewrite]
set(datapoint.sum, ...) only rewrites the histogram's sum field. Bucket boundaries, count, min, and max stay in
raw token units. This is fine for the _sum-based queries used throughout this guide. Avoid running
histogram_quantile or other bucket-based queries against gen_ai_client_token_usage downstream of this
transform, since sum and buckets no longer share a unit.
With this transform in place, gen_ai_client_token_usage_sum already reports USD in Prometheus. No recording rule
is needed:
sum by (app_name) (increase(gen_ai_client_token_usage_sum[30d]))
If Prometheus scrapes Traefik Hub directly, or you want to keep pricing logic out of the collector pipeline, apply the same multiplication with a Prometheus recording rule instead:
apiVersion: monitoring.coreos.com/v1
kind: PrometheusRule
metadata:
  name: ai-cost-rules
  namespace: monitoring
spec:
  groups:
    - name: ai_cost
      interval: 5m
      rules:
        # USD cost per 1 000 tokens by model and token type (update as pricing changes)
        - record: ai_token_price_per_1k
          expr: |
            label_replace(
              label_replace(vector(0.0025), "gen_ai_response_model", "gpt-4o", "", "")
              or
              label_replace(vector(0.00015), "gen_ai_response_model", "gpt-4o-mini", "", ""),
              "gen_ai_token_type", "input", "", ""
            )
            or
            label_replace(
              label_replace(vector(0.01), "gen_ai_response_model", "gpt-4o", "", "")
              or
              label_replace(vector(0.0006), "gen_ai_response_model", "gpt-4o-mini", "", ""),
              "gen_ai_token_type", "output", "", ""
            )

        # Rolling 30-day token spend per team, model, and token type
        - record: ai_token_spend_30d
          expr: |
            increase(gen_ai_client_token_usage_sum[30d])

        # Rolling 30-day estimated cost in USD per team
        - record: ai_estimated_cost_usd_30d
          expr: |
            sum by (app_name) (
              ai_token_spend_30d
              * on(gen_ai_response_model, gen_ai_token_type)
              group_left()
              ai_token_price_per_1k
            ) / 1000
Verify the recording rule produces values:
ai_estimated_cost_usd_30d
You should see one series per app_name showing the estimated USD spend over the last 30 days. The recording rule
is the most efficient option when cost panels are queried often, since the multiplication happens once per
Prometheus evaluation interval, not on every dashboard load.
For a quick proof of concept, skip both of the above and do the multiplication at query time instead. Multiply the
raw gen_ai_client_token_usage_sum series by a price constant directly in the Grafana panel, using the panel's
"Add field from calculation" transform or a query expression. This avoids touching the collector or Prometheus
configuration, at the cost of repeating the price constant in every panel that needs it.
Step 3: Visualize costs in Grafana
An example Traefik AI Gateway Dashboard can be organized into three sections: Models, Performance, and Users. Use the Model, Response Model, App, and API filter variables at the top to narrow any panel to a specific team or model.
Models section
The Models section shows aggregate token economy: how many tokens were spent, how many were saved by the Semantic Cache, and how spend breaks down by model.
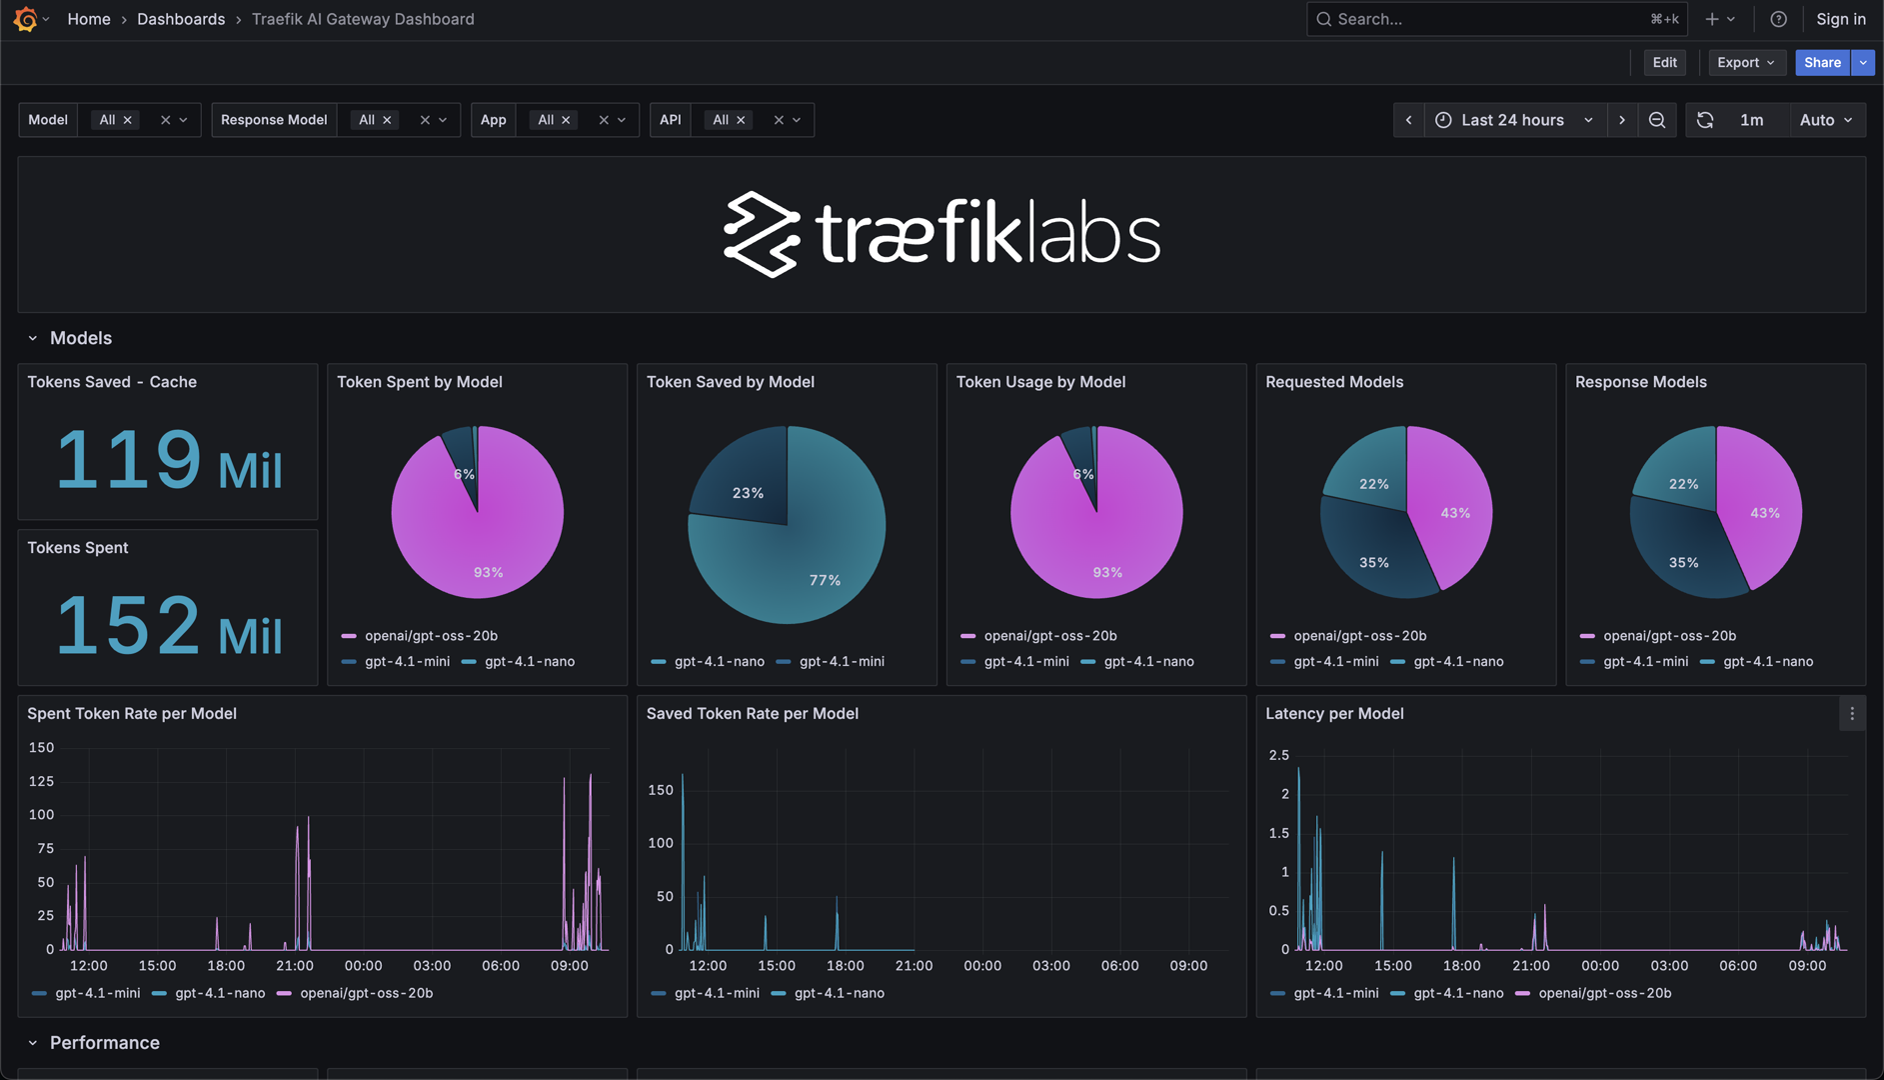
Key panels:
- Tokens Saved - Cache and Tokens Spent stat panels give an immediate headline of cache efficiency. In the example above, 119M tokens were saved against 152M spent, a 44% reduction in upstream cost.
- Token Spent by Model and Token Saved by Model pie charts identify which models drive the most spend and which benefit most from caching. Use these to decide where to invest in expanding cache coverage.
- Spent Token Rate per Model and Saved Token Rate per Model time-series panels show usage spikes over time, useful for correlating cost events with application deployments or traffic changes.
PromQL for the headline numbers:
# Total tokens spent (last 24h)
sum(increase(gen_ai_client_token_usage_sum[24h]))

# Total tokens saved by cache (last 24h)
sum(increase(traefik_hub_semantic_cache_token_saved_total[24h]))
Performance section
The Performance section covers request health: total requests, error rates, RPS by API, and latency. Use it to correlate cost spikes with error bursts or latency degradation.
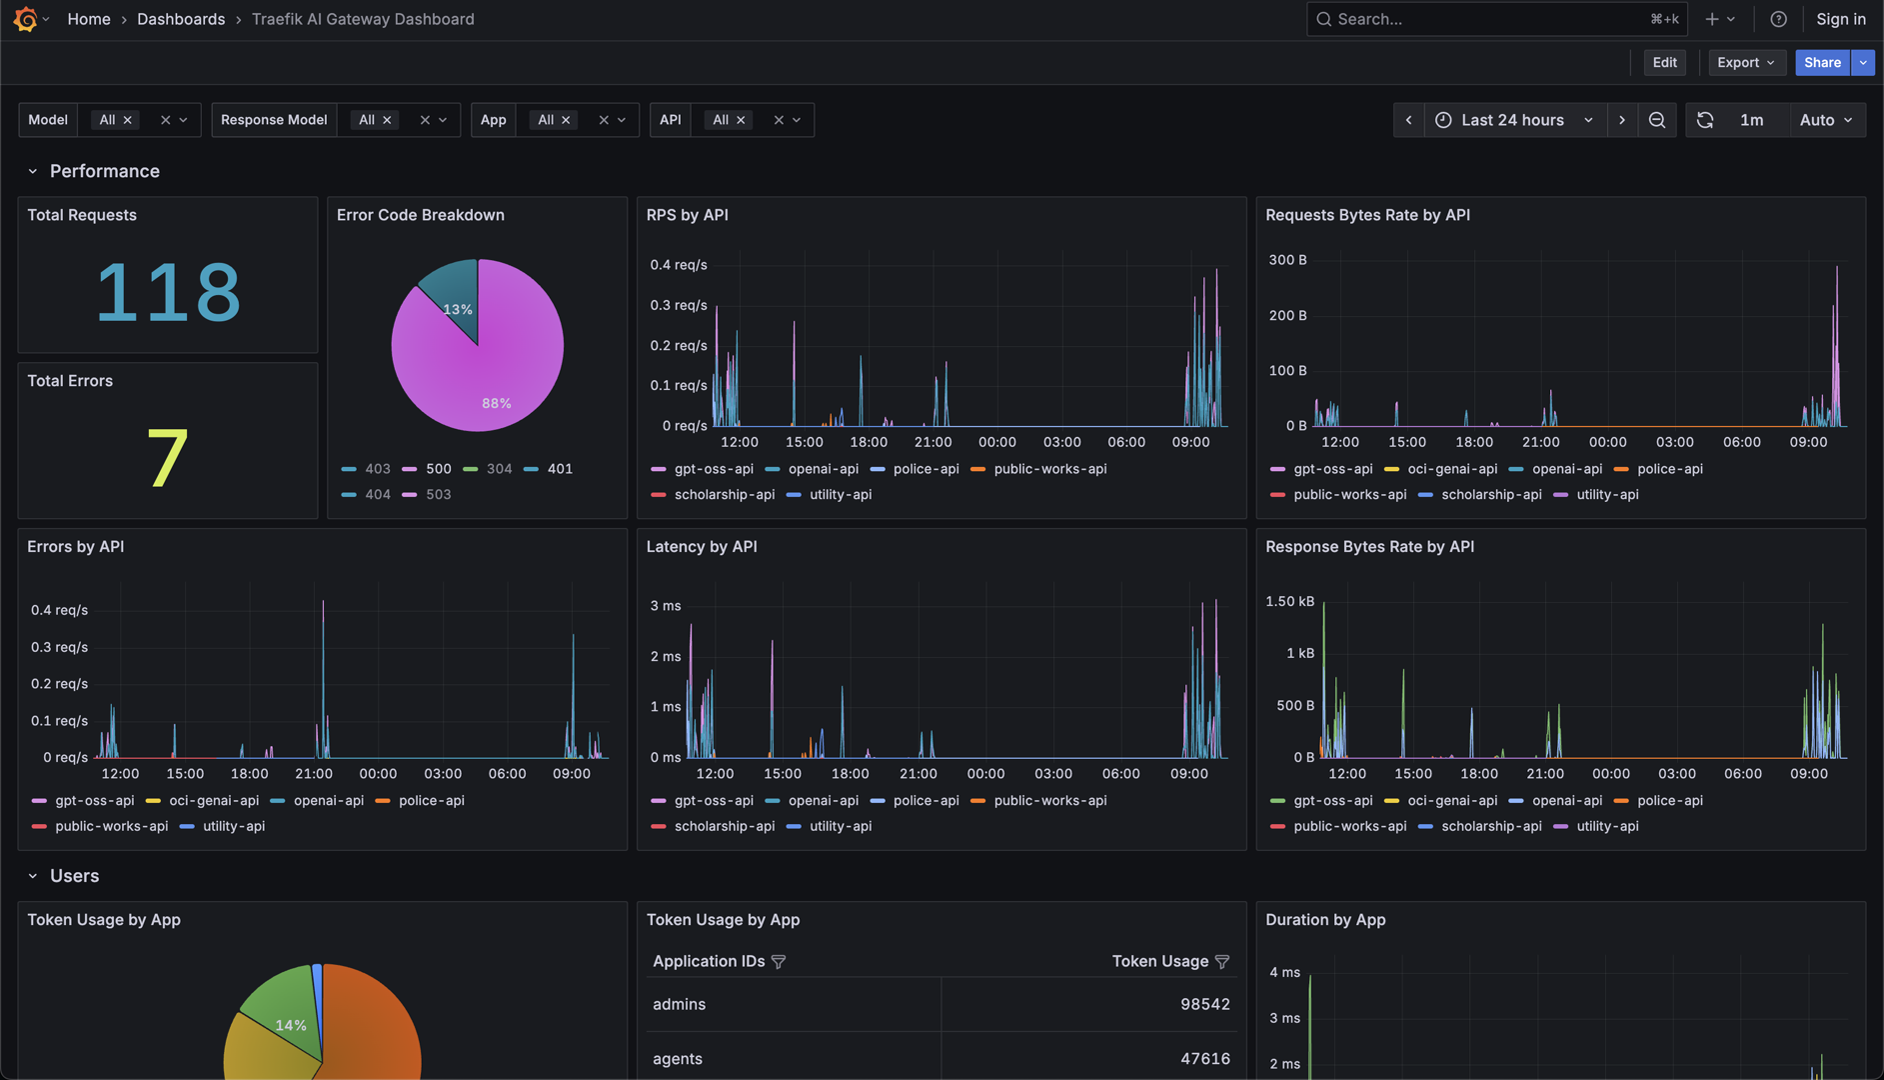
The API filter variable lets you isolate a single route (for example openai-api or scholarship-api)
across all panels simultaneously.
Users section
The Users section attributes token consumption to individual applications, using the app_name label set by API Management.
This is the view to share with team leads or include in a monthly spending report.
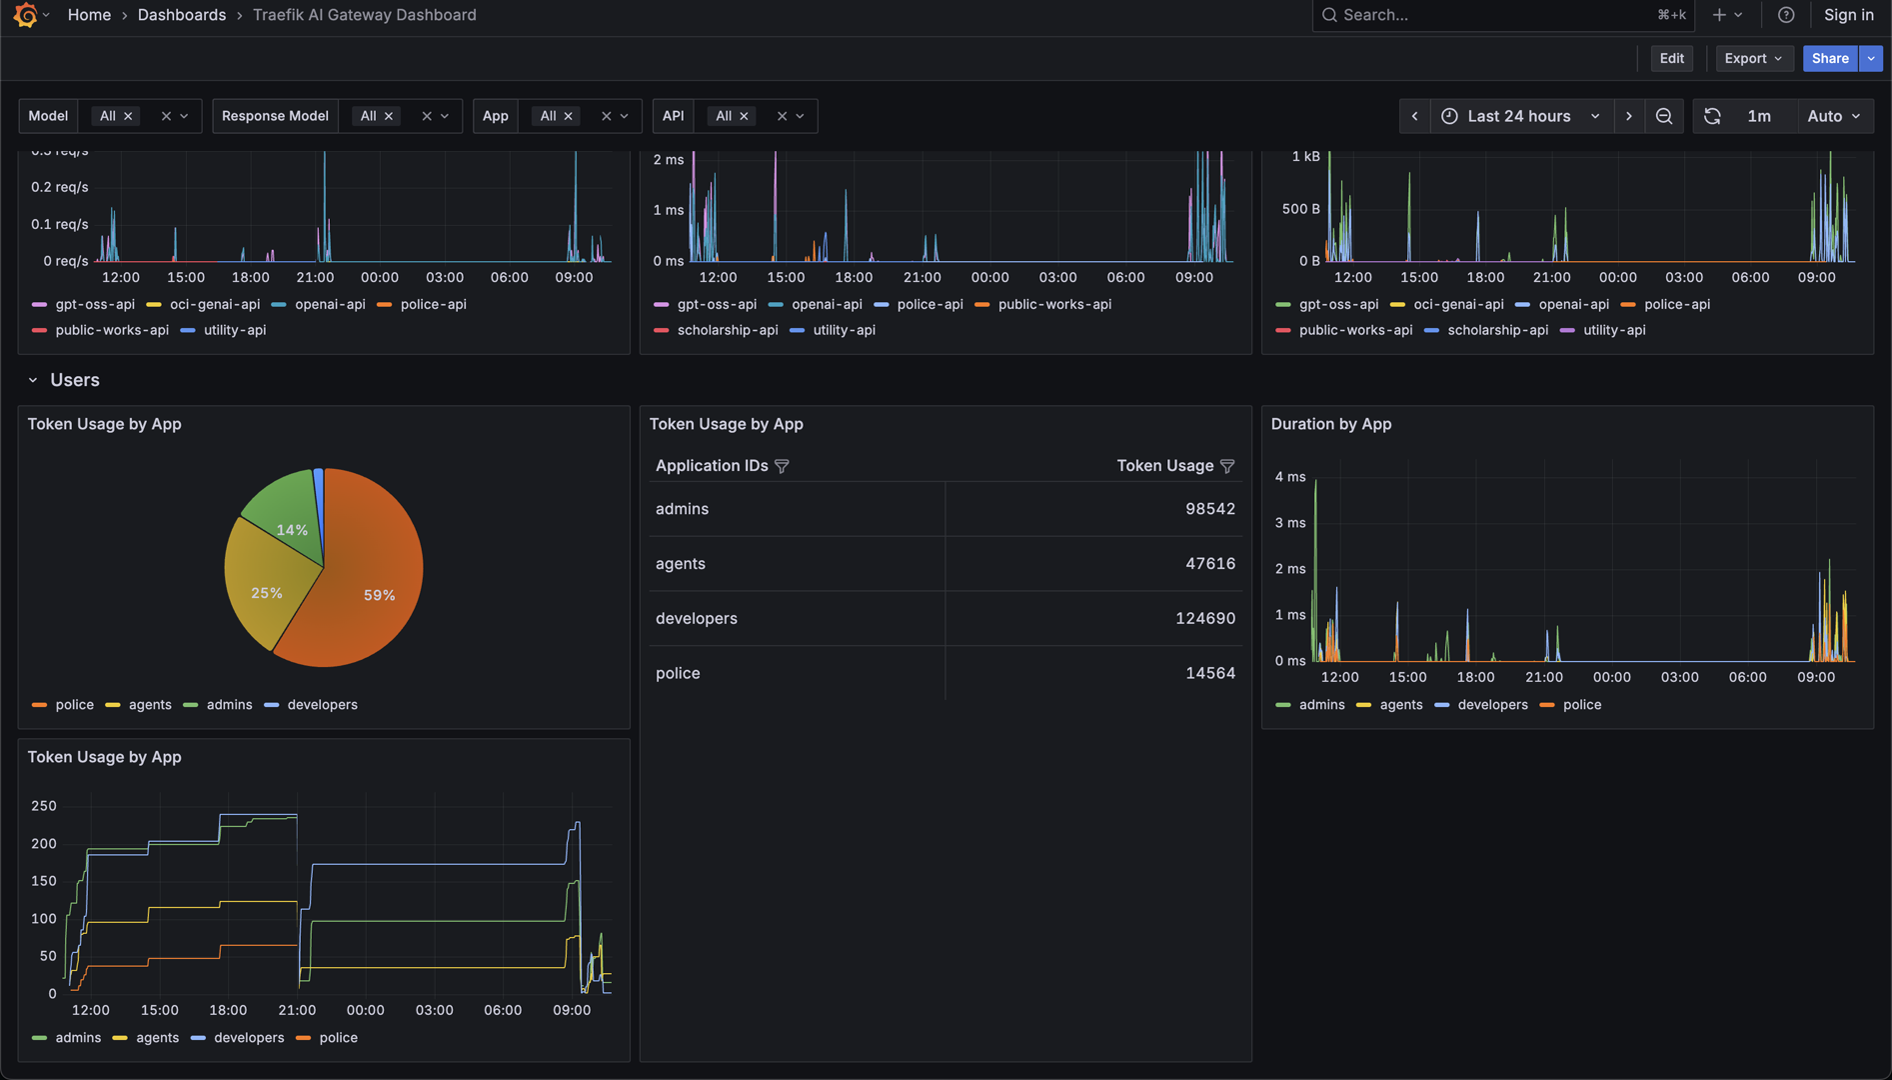
Key panels:
- Token Usage by App pie chart gives the share of total token spend per team at a glance.
- Token Usage by App table lists the raw token counts per application, sortable for quick ranking.
- Token Usage by App time-series shows how each team's consumption evolves, making budget run-rate visible.
- Duration by App helps identify teams making unusually slow requests (long completions or high latency upstream).
PromQL for the per-team token table:
sum by (app_name) (
  increase(gen_ai_client_token_usage_sum[30d])
)
And the estimated cost per team, using whichever path you picked in Step 2:
# gen_ai.client.operation.cost metric: skips Step 2's manual pricing entirely
sum by (app_name) (increase(gen_ai_client_operation_cost_sum[30d]))

# OTel Collector transform: gen_ai_client_token_usage_sum already reports USD
sum by (app_name) (increase(gen_ai_client_token_usage_sum[30d]))

# Prometheus recording rule: ai_estimated_cost_usd_30d holds the converted value
ai_estimated_cost_usd_30d
The Tokens Saved - Cache stat in the Models section reflects traefik_hub_semantic_cache_token_saved_total.
Enable it by setting observability.metrics.level: detailed on the AI middleware as described in
Monitor Token Usage and Cache Savings.
Step 4: Set a budget alert at 90%
Define monthly token budgets per team and alert when any team crosses 90%. The example below uses Grafana alerting, but the same PromQL query works in Alertmanager.
Monthly token budgets for this fictive organization:
| Team | Monthly token budget | Approx. USD cap |
|---|---|---|
| Engineering | 5 000 000 | ~$50 |
| Marketing | 1 000 000 | ~$10 |
| Data Science | 10 000 000 | ~$100 |
Create a Grafana alert rule with the following configuration:
# Percentage of monthly budget consumed per team
(
  increase(gen_ai_client_token_usage_sum{app_name="engineering"}[30d])
  / 5000000
) * 100
Set the alert to trigger when the value exceeds 90. Repeat for each team, replacing the app_name filter and budget denominator.
To alert on all teams at once without repeating the rule, use a multi-dimensional query:
(
  sum by (app_name) (increase(gen_ai_client_token_usage_sum[30d]))
  / on(app_name) group_left()
  (
      label_replace(vector(5000000),  "app_name", "engineering",  "", "")
    or
      label_replace(vector(1000000),  "app_name", "marketing",    "", "")
    or
      label_replace(vector(10000000), "app_name", "data-science", "", "")
  )
) * 100 > 90
In Grafana, set:
- Condition:
IS ABOVE 90 - Evaluation interval:
5m - For:
15m(avoid noise from brief spikes) - Labels: add
severity=warningandteam={{ $labels.app_name }} - Annotations: include
summary = "{{ $labels.app_name }} has used {{ $values.A | humanize }}% of its monthly token budget"
Step 5: Enforce hard limits with Token Rate Limit
Alerts notify. They do not stop spending. Use the Token Rate Limit & Quota
middleware in ai-quota mode to cut off requests once a team exceeds its budget.
So far, all teams have shared the single route from Step 1. Enforcing a hard, per-team cap means each team needs
its own quota middleware instance with its own limit. This means splitting that single route into three, one
per team, each combining the team's quota middleware with the shared openai-chat middleware.
Add one quota middleware per team and stack it after the AI middleware in the IngressRoute:
- Engineering
- Marketing
- Data Science
apiVersion: traefik.io/v1alpha1
kind: Middleware
metadata:
  name: quota-engineering
  namespace: apps
spec:
  plugin:
    ai-quota:
      store:
        redis:
          endpoints: ["redis.default.svc.cluster.local:6379"]
      totalTokenLimit:
        limit: 5000000  # 5M tokens/month
        period: 720h    # 30 days
        jsonQuery: ".usage.total_tokens"
      sourceCriterion:
        requestHeaderName: X-Team
      onDenyResponse:
        statusCode: 429
        message: "Monthly token budget for Engineering exceeded. Contact your admin."
apiVersion: traefik.io/v1alpha1
kind: Middleware
metadata:
  name: quota-marketing
  namespace: apps
spec:
  plugin:
    ai-quota:
      store:
        redis:
          endpoints: ["redis.default.svc.cluster.local:6379"]
      totalTokenLimit:
        limit: 1000000  # 1M tokens/month
        period: 720h
        jsonQuery: ".usage.total_tokens"
      sourceCriterion:
        requestHeaderName: X-Team
      onDenyResponse:
        statusCode: 429
        message: "Monthly token budget for Marketing exceeded. Contact your admin."
apiVersion: traefik.io/v1alpha1
kind: Middleware
metadata:
  name: quota-data-science
  namespace: apps
spec:
  plugin:
    ai-quota:
      store:
        redis:
          endpoints: ["redis.default.svc.cluster.local:6379"]
      totalTokenLimit:
        limit: 10000000 # 10M tokens/month
        period: 720h
        jsonQuery: ".usage.total_tokens"
      sourceCriterion:
        requestHeaderName: X-Team
      onDenyResponse:
        statusCode: 429
        message: "Monthly token budget for Data Science exceeded. Contact your admin."
Create the three per-team IngressRoutes, splitting off from the single route used in Step 1, each combining its quota middleware with the shared AI middleware:
- Engineering
- Marketing
- Data Science
apiVersion: traefik.io/v1alpha1
kind: IngressRoute
metadata:
  name: engineering-ai
  namespace: apps
spec:
  entryPoints: [websecure]
  routes:
    - match: Host(`ai.example.com`) && Header(`X-Team`, `engineering`)
      kind: Rule
      middlewares:
        - name: openai-chat         # AI middleware first
        - name: quota-engineering   # quota checked second
      services:
        - name: openai-proxy
          port: 443
apiVersion: traefik.io/v1alpha1
kind: IngressRoute
metadata:
  name: marketing-ai
  namespace: apps
spec:
  entryPoints: [websecure]
  routes:
    - match: Host(`ai.example.com`) && Header(`X-Team`, `marketing`)
      kind: Rule
      middlewares:
        - name: openai-chat         # AI middleware first
        - name: quota-marketing     # quota checked second
      services:
        - name: openai-proxy
          port: 443
apiVersion: traefik.io/v1alpha1
kind: IngressRoute
metadata:
  name: datascience-ai
  namespace: apps
spec:
  entryPoints: [websecure]
  routes:
    - match: Host(`ai.example.com`) && Header(`X-Team`, `data-science`)
      kind: Rule
      middlewares:
        - name: openai-chat         # AI middleware first
        - name: quota-data-science  # quota checked second
      services:
        - name: openai-proxy
          port: 443
With this setup, once a team's quota is used up, its next requests receive a 429 and don't reach
the LLM. The request that crosses the limit is not denied. Its cost is counted after the response
completes, so that request still goes through, see
Cost Limit Enforcement.
The Grafana alert notifies teams once usage reaches 90%, and the quota middleware denies requests
once usage reaches 100%.
Alternative: Enforce a Dollar Budget Directly
The quota-engineering middleware sets totalTokenLimit: 5000000, a token count computed in Step 2 by
dividing a 50 USD budget by GPT-4o's per-token price. A provider price change or a shift in the team's
model mix requires recalculating this number by hand.
Replace totalTokenLimit with costLimit and
set limit to the dollar budget directly. costLimit needs a priceable request format: ccr,
responsesAPI, or messagesAPI.
apiVersion: traefik.io/v1alpha1
kind: Middleware
metadata:
  name: quota-engineering-cost
  namespace: apps
spec:
  plugin:
    ai-quota:
      clientRequestFormat: ccr
      store:
        redis:
          endpoints: ["redis.default.svc.cluster.local:6379"]
      costLimit:
        limit: 50.00  # USD/month
        period: 720h  # 30 days
      sourceCriterion:
        requestHeaderName: X-Team
      onDenyResponse:
        statusCode: 429
        message: "Monthly budget for Engineering exceeded. Contact your admin."
Replace quota-engineering with quota-engineering-cost in the Engineering IngressRoute, keeping
everything else the same. Enforced cost is an estimate against the provider-reported token counts, not
a substitute for your provider's own invoice. See
Cost-Based Limits for the full reference,
including allowMissingPricing for a model with no listed price.
