Leveraging Oracle APM to Visualize Traefik Hub OpenTelemetry Metrics
Prerequisites
Before you begin, ensure you have:
- An OCI Kubernetes Engine cluster
- Traefik Hub installed and running in your OCI Kubernetes Engine cluster. If you haven't set this up yet, follow one of these guides:
- Logging Analytics Configured for Traefik Hub. If you haven't set this up yet, follow this guide:
- Oracle Cloud Infrastructure Prerequisites completed for APM
Create an APM Domain
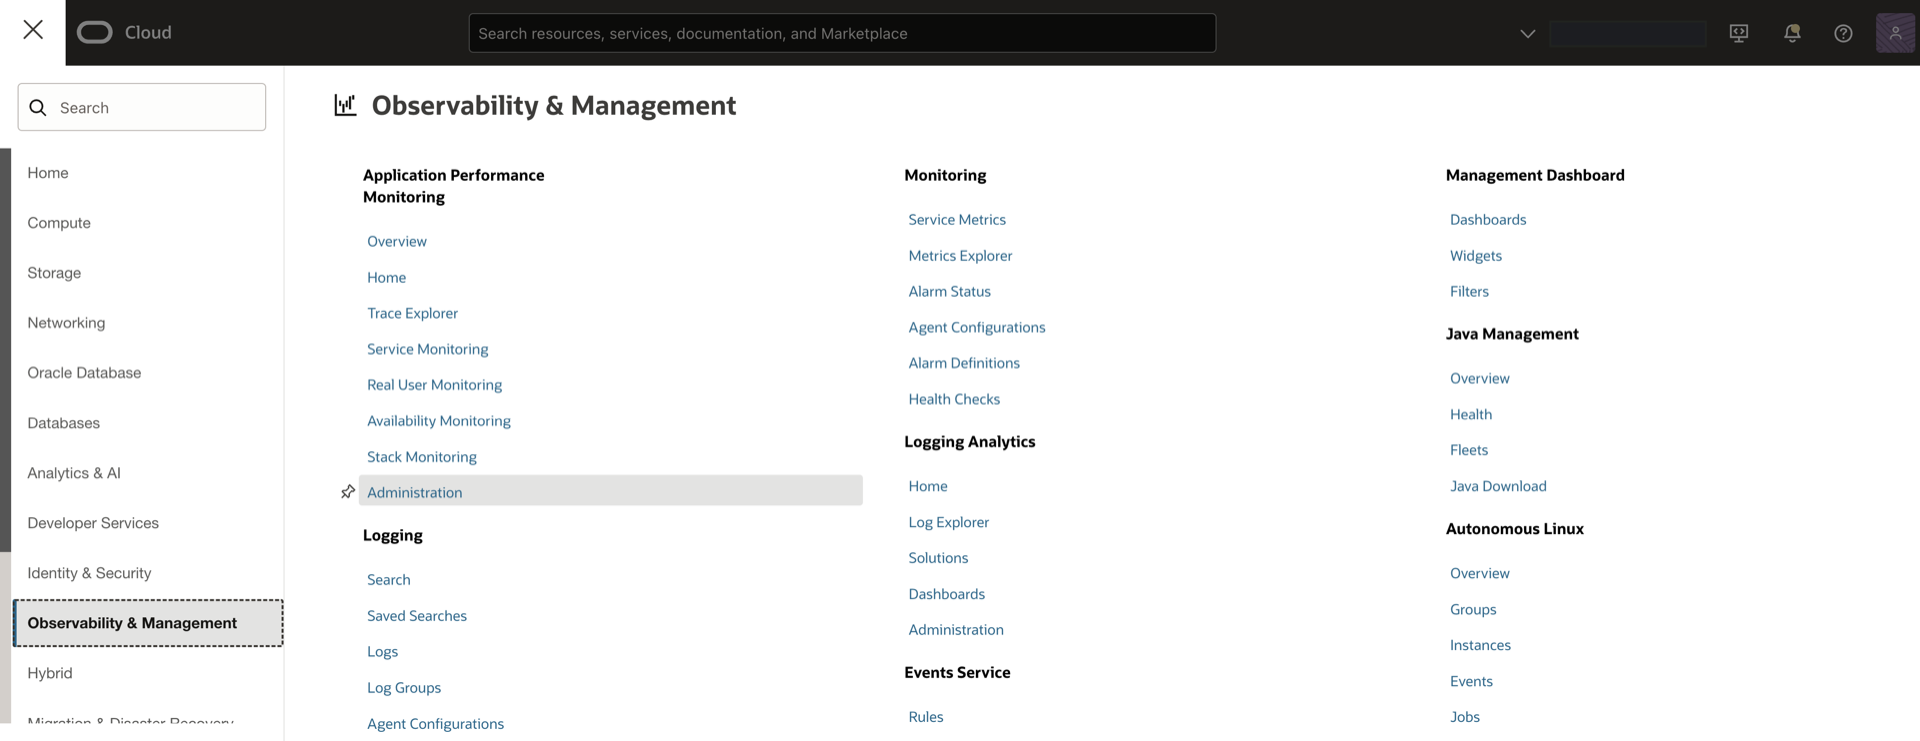
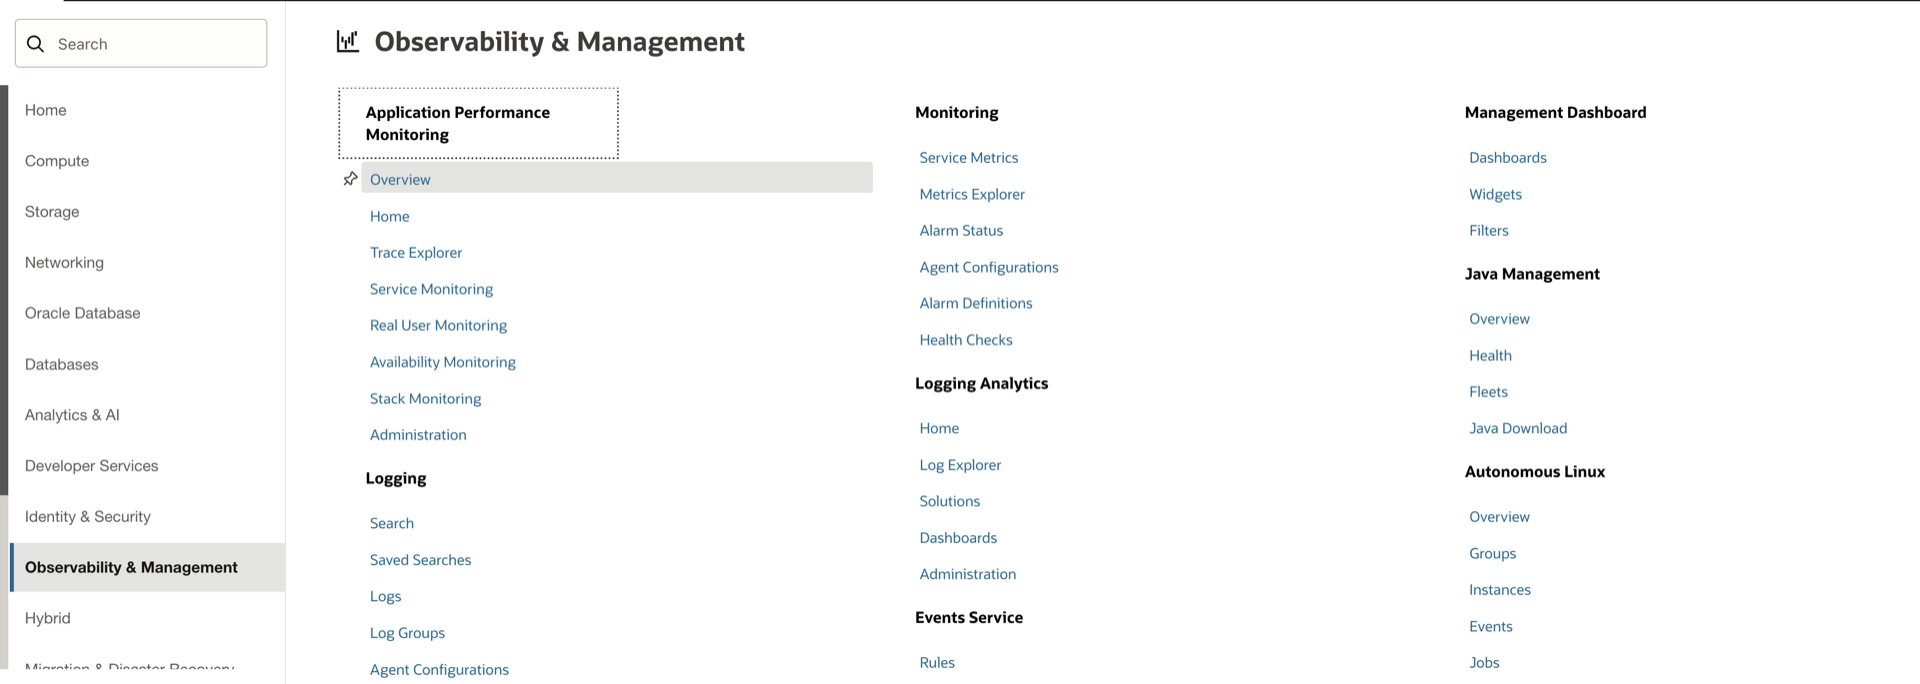
- Navigate to Observability & Management >> Administration >> APM Domain
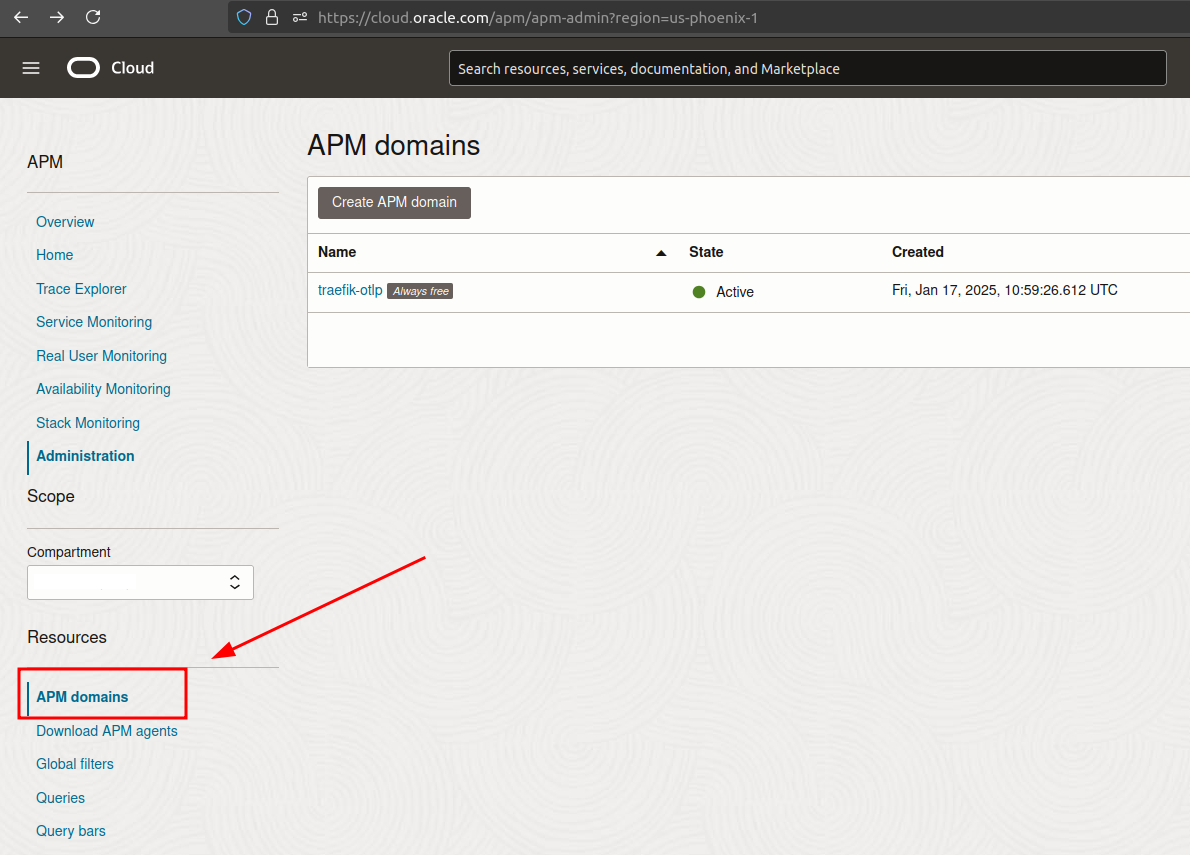
-
Click Create APM Domain
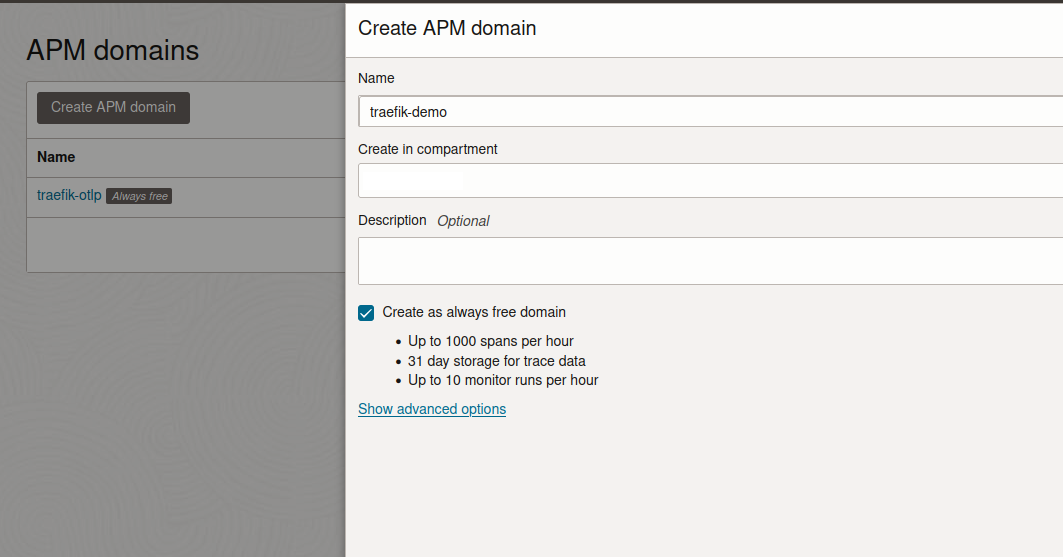
-
Fill in the required fields:
- Name for your APM Domain
- Select your compartment
- Choose the data retention period
After creation, note down two important pieces of information:
- The Data Upload Endpoint from the domain details
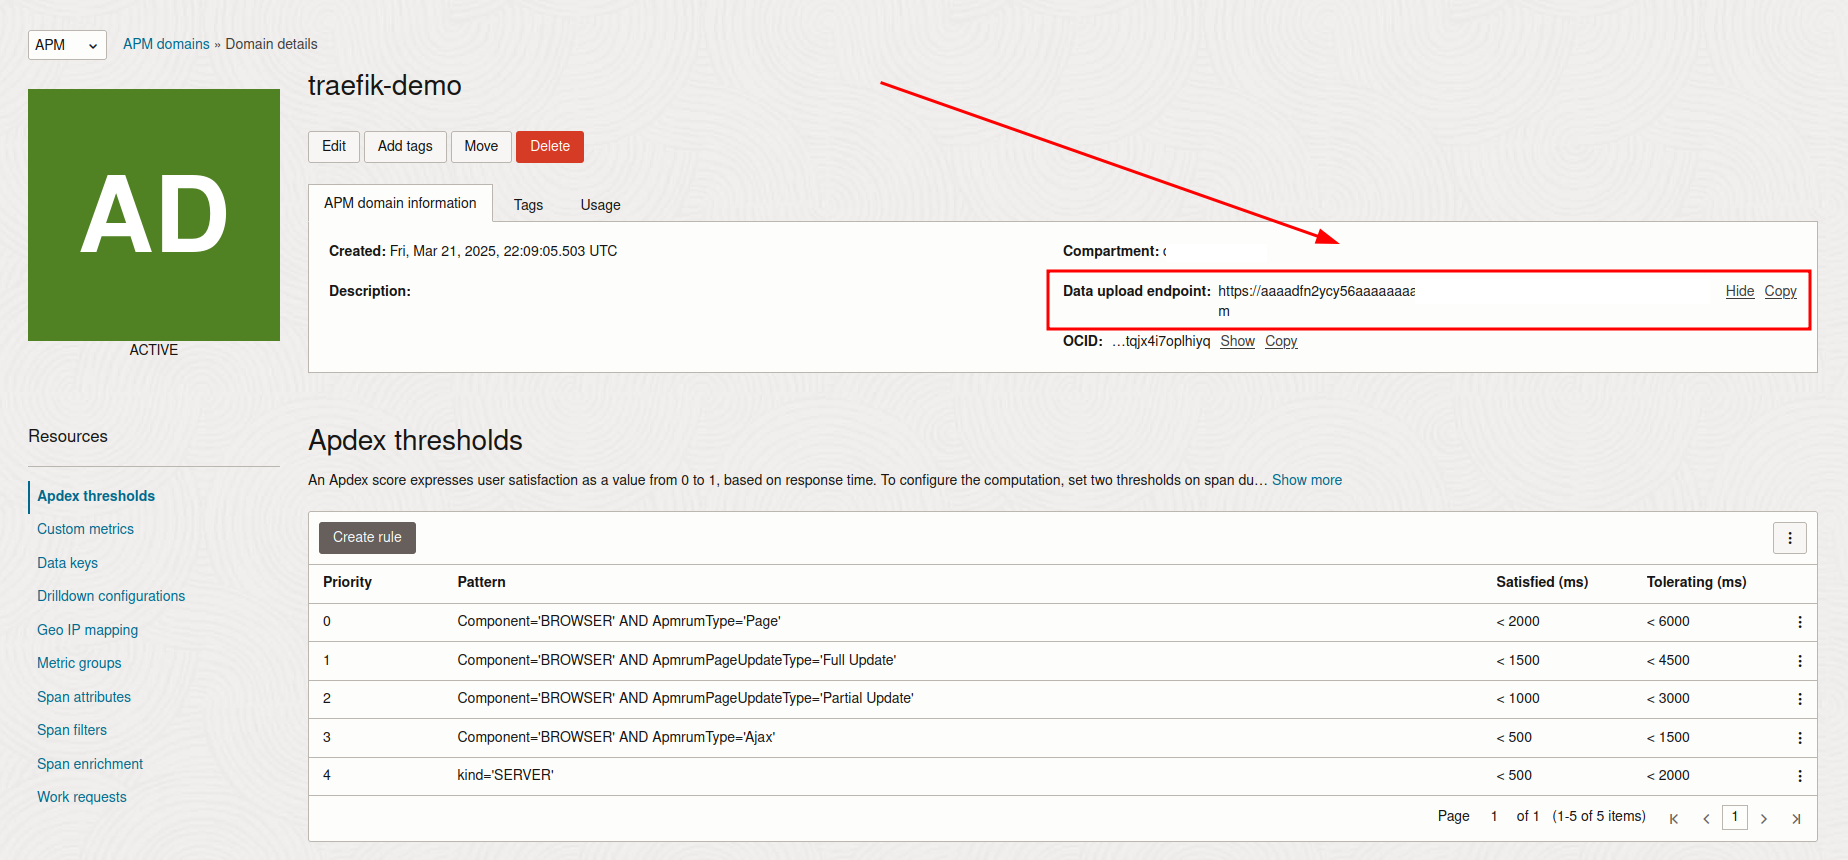
- The Private Key from the Data Keys section (you'll need to create one if it doesn't exist)
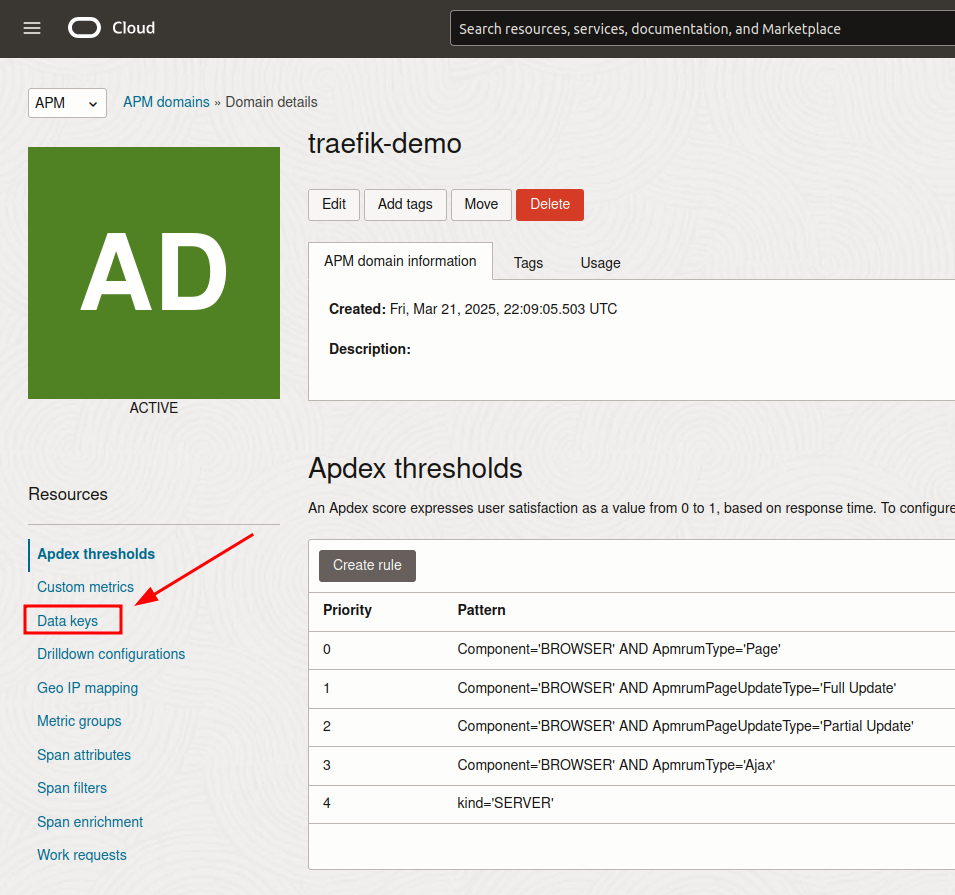
info
Store both the Data Upload Endpoint and Private Key securely - you'll need them to configure Traefik Hub.
Update Traefik Hub Configuration
For OCI DevOps Deployment
- Navigate to your DevOps project: Developer Services >> Projects >> Your Project Name >> Artifacts
- Locate your Traefik Helm Values artifact and select Edit
- Append the following configuration to enable OpenTelemetry metrics:
metrics:
  otlp:
    enabled: true
    http:
      enabled: true
      endpoint: "<YOUR_DATA_UPLOAD_ENDPOINT>/20200101/opentelemetry/v1/metrics"
      headers:
        Authorization: "dataKey <YOUR_PRIVATE_KEY>"
tracing:
  otlp:
    enabled: true
    http:
      enabled: true
      endpoint: "<YOUR_DATA_UPLOAD_ENDPOINT>/20200101/opentelemetry/private/v1/traces"
      headers:
        Authorization: "dataKey <YOUR_PRIVATE_KEY>"
logging:
  otlp:
    enabled: true
    http:
      enabled: true
      endpoint: "<YOUR_DATA_UPLOAD_ENDPOINT>/20200101/opentelemetry/v1/logging"
      headers:
        Authorization: "dataKey <YOUR_PRIVATE_KEY>"
- Save the changes
- Run your deployment pipeline to apply the changes:
- Go to Deployment Pipelines
- Select your pipeline
- Click Run pipeline and select Start manual run
For OCI Marketplace Deployment
- Access your OCI Kubernetes Engine cluster—either locally using the cluster’s kubeconfig file or via the OCI Cloud Shell.
- Create a file named
traefik-apm-values.yamlwith the configuration above - Update your Traefik deployment:
helm upgrade traefik traefik/traefik \
  -f traefik-apm-values.yaml \
  --reuse-values \
  -n traefik
Viewing APM Metrics
- Navigate to Observability & Management → Application Performance Monitoring → Overview. In the side menu, click Dashboards.
- From the list, click Traefik Dashboard. Your Traefik Hub metrics appear in the APM view.
note
- Make sure to select the right APM Domain in the dahsboard
- It might take some time for your metrics to populate the dashboard
Troubleshooting
If you don't see metrics in APM:
- Verify the configuration is correctly applied by running the following command in your OCI Kubernetes Engine cluster:
kubectl get deployment traefik -n traefik -o yaml
- Verify the APM Domain status is Active in the OCI Console
For a comprehensive list of all available metrics and their descriptions, refer to the Traefik Hub Metrics Reference Documentation.
Next Steps
With APM configured, you can:
- Create custom dashboards for your metrics
- Set up alerts based on performance thresholds
- Analyze service dependencies and bottlenecks
- Monitor API performance and availability
That's it! You have successfully configured Oracle APM for Traefik Hub.
