Leveraging OCI Logging Analytics for Deeper Troubleshooting Using Logs from Traefik Hub
Prerequisites
Before you begin, ensure you have:
- An OCI Kubernetes Engine cluster
- Traefik Hub installed and running in your OCI Kubernetes Engine cluster. If you haven't set this up yet, follow one of these guides:
- OCI Logging Analytics service enabled in your tenancy
Enable Logging Analytics
First, ensure you have the necessary permissions and access to OCI Logging Analytics. You'll need:
- Access to the Logging Analytics service
- Appropriate IAM policies for Logging Analytics
- Access to the compartment where you want to store logs
info
If you haven't enabled Logging Analytics yet, follow the official documentation to set it up.
Import Traefik Log Source Configuration
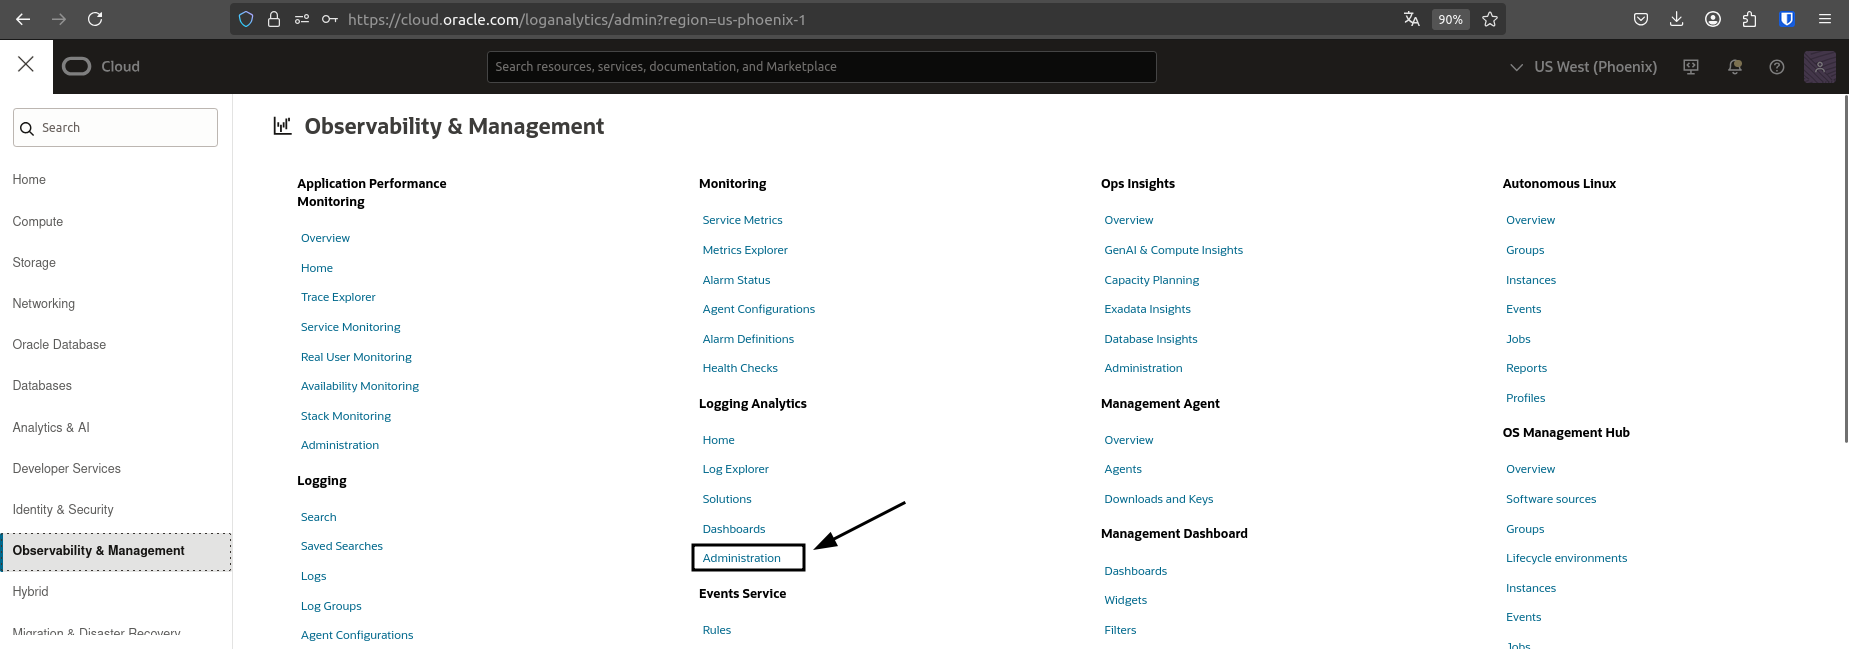
- Navigate to Logging Analytics in the OCI Console
- Select Administration from the left menu
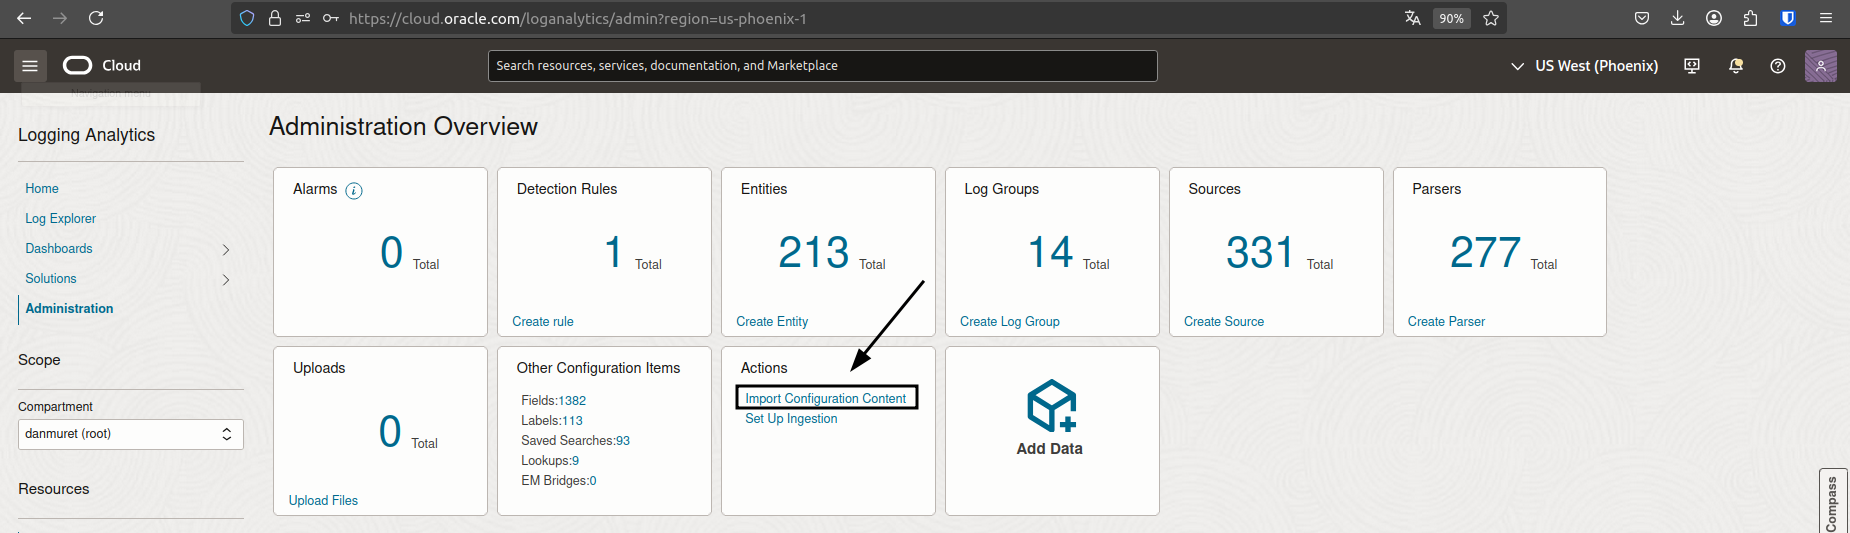
- Under Actions, select Import Configuration Content
- Upload the Traefik Log Source configuration zip file
Configure Kubernetes Monitoring
- Navigate to Observability & Management >> Solutions
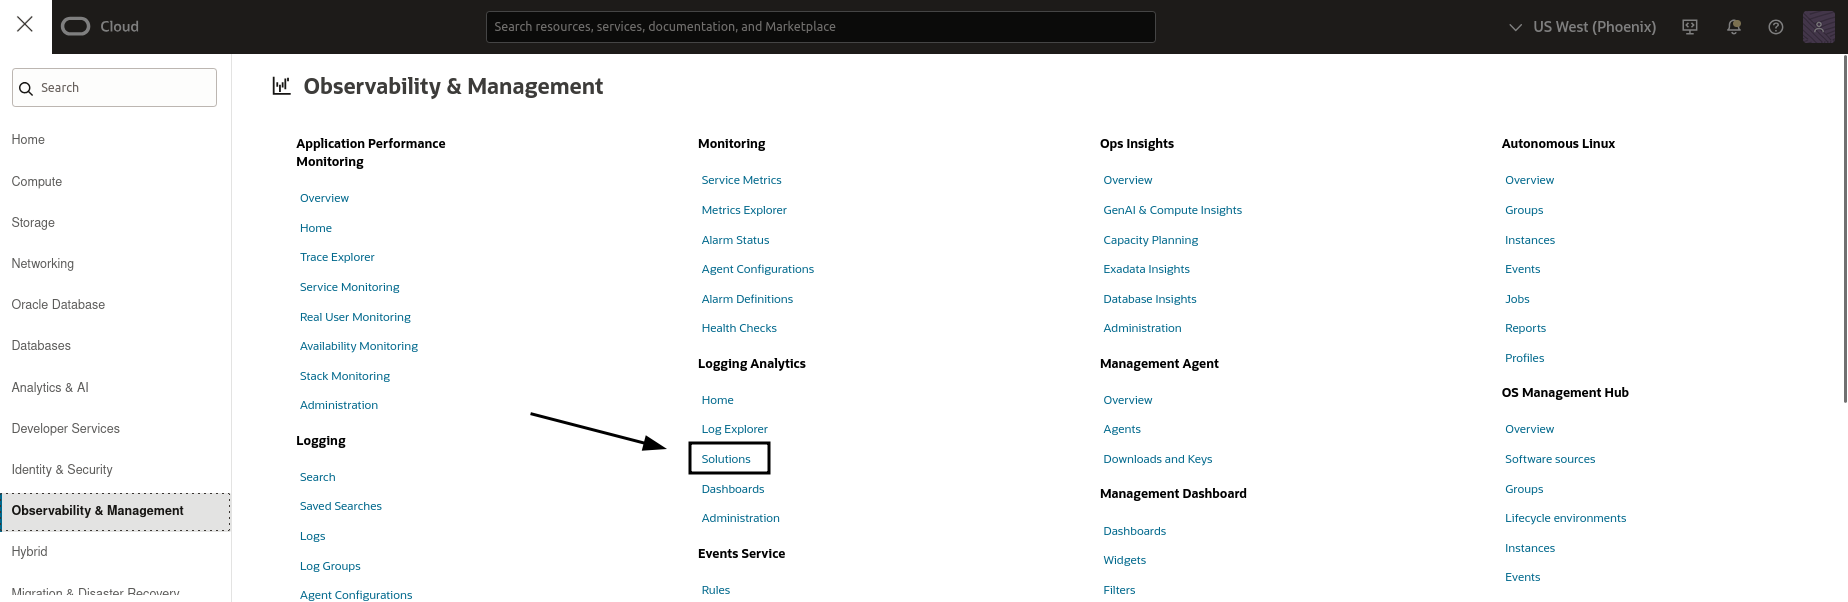
- Select Connect Clusters
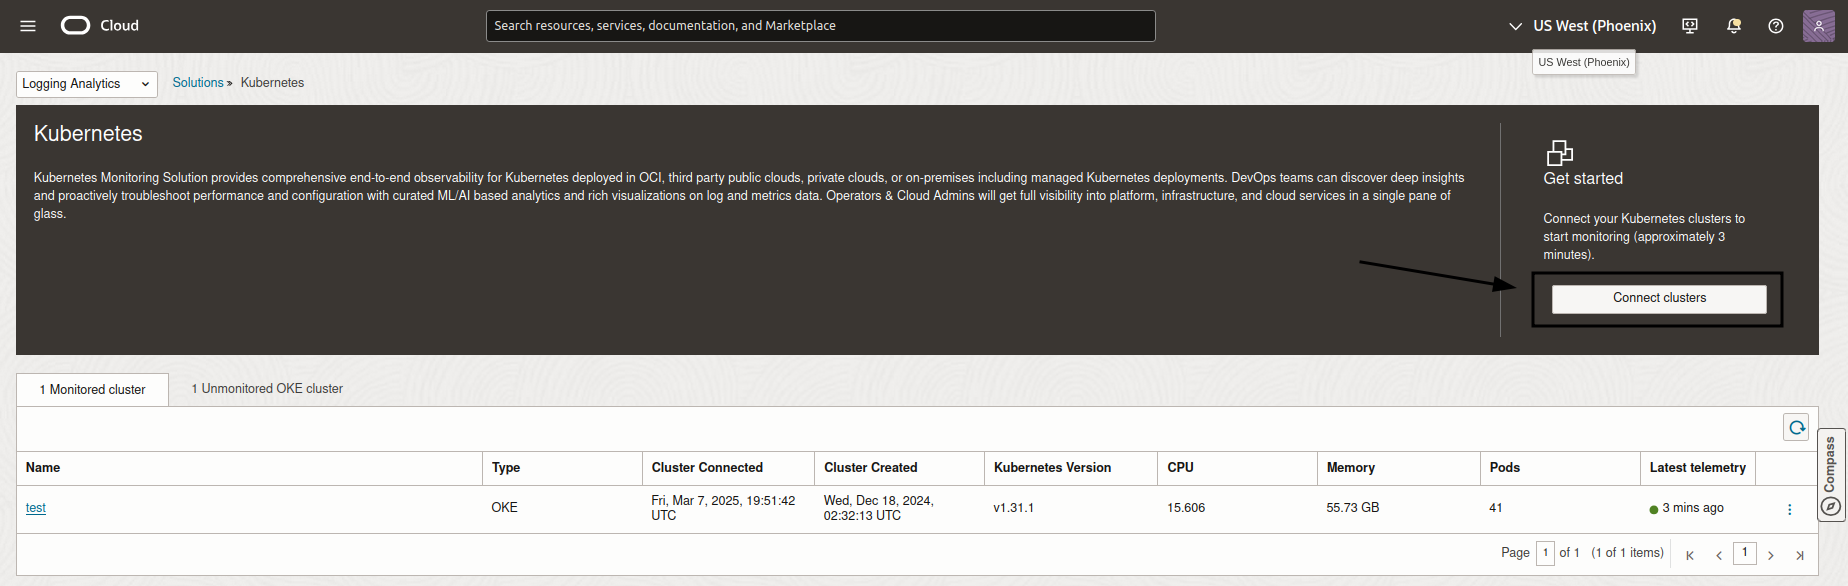
- Choose Oracle OCI Kubernetes Engine under Monitor Kubernetes
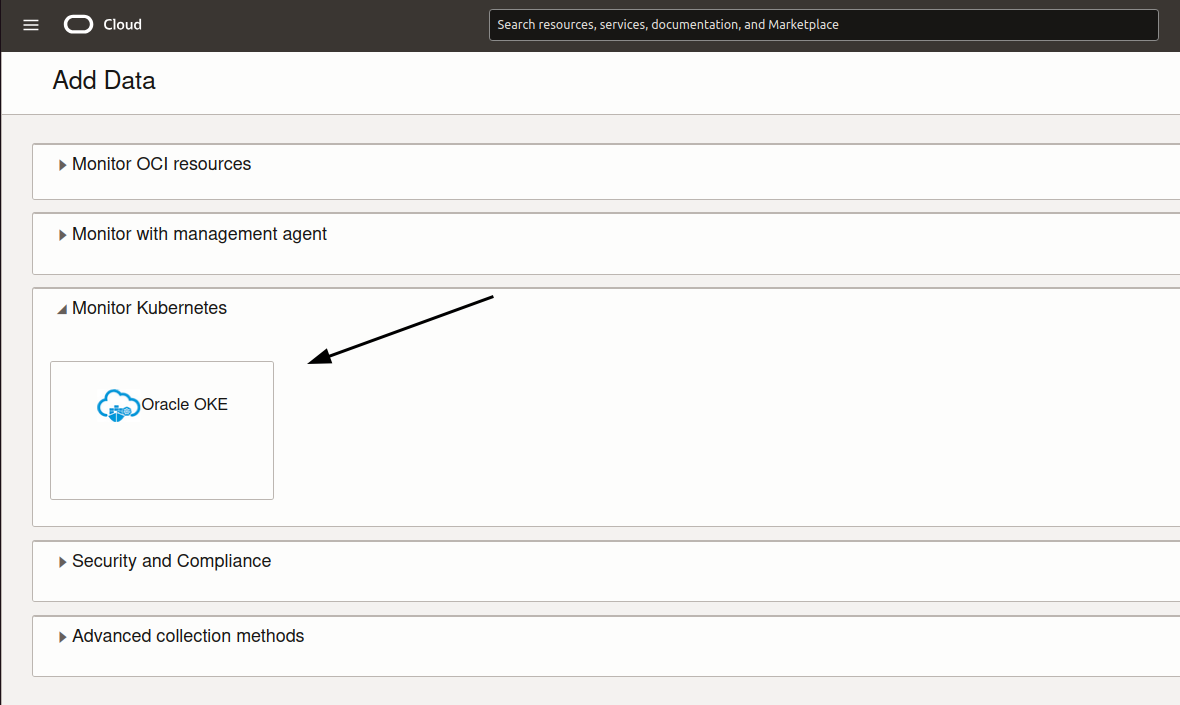
- Select your OCI Kubernetes Engine cluster and proceed to the next step
Configure log collection settings
- If your cluster already has a metrics server installed, uncheck the "Install Metrics Server" option
- If not, leave it checked to install the metrics server
Update Traefik Hub Configuration
For OCI DevOps Deployment
- Navigate to your DevOps project: Developer Services >> Projects >> Your Project Name >> Artifacts
- Locate your Traefik Helm Values artifact and select Edit
- Add the following configuration to enable log collection:
deployment:
  podAnnotations:
    oracle.com/oci_la_log_source_name: Traefik - Access Logs - v2
- Save the changes
- Run your deployment pipeline to apply the changes:
- Go to Deployment Pipelines
- Select your pipeline
- Click Run pipeline and select Start manual run
For OCI Marketplace Deployment
- Access your OCI Kubernetes Engine cluster—either locally using the cluster’s kubeconfig file or via the OCI Cloud Shell.
- Patch the Traefik deployment to add the annotation:
kubectl patch deployment traefik -n traefik --patch '{"spec":{"template":{"metadata":{"annotations":{"oracle.com/oci_la_log_source_name":"Traefik - Access Logs - v2"}}}}}'
Viewing and Creating Dashboards
You have two options for creating dashboards to visualize your Traefik Hub logs:
Option 1: Create a Custom Dashboard
- Navigate to Observability & Management >> Logging Analytics >> Dashboards
- Click Create Dashboard
- Add logging chart widgets to visualize your Traefik Hub logs:
- Select Logging chart as the widget type
- Configure the widget with:
- Name and description
- Region selection
- Visualization type (e.g., line chart, bar chart)
- Time interval for refreshes
- Grouping criteria
- Custom filters for your Traefik logs
- Add multiple widgets to monitor different aspects:
- API Requests
- API Requests Duration
- IngressRoutes
- API Plans
- Requests TLS
- Request per Endpoint
Option 2: Import a Pre-configured Dashboard
If you prefer a pre-configured dashboard:
- Navigate to Observability & Management >> Logging Analytics >> Dashboards
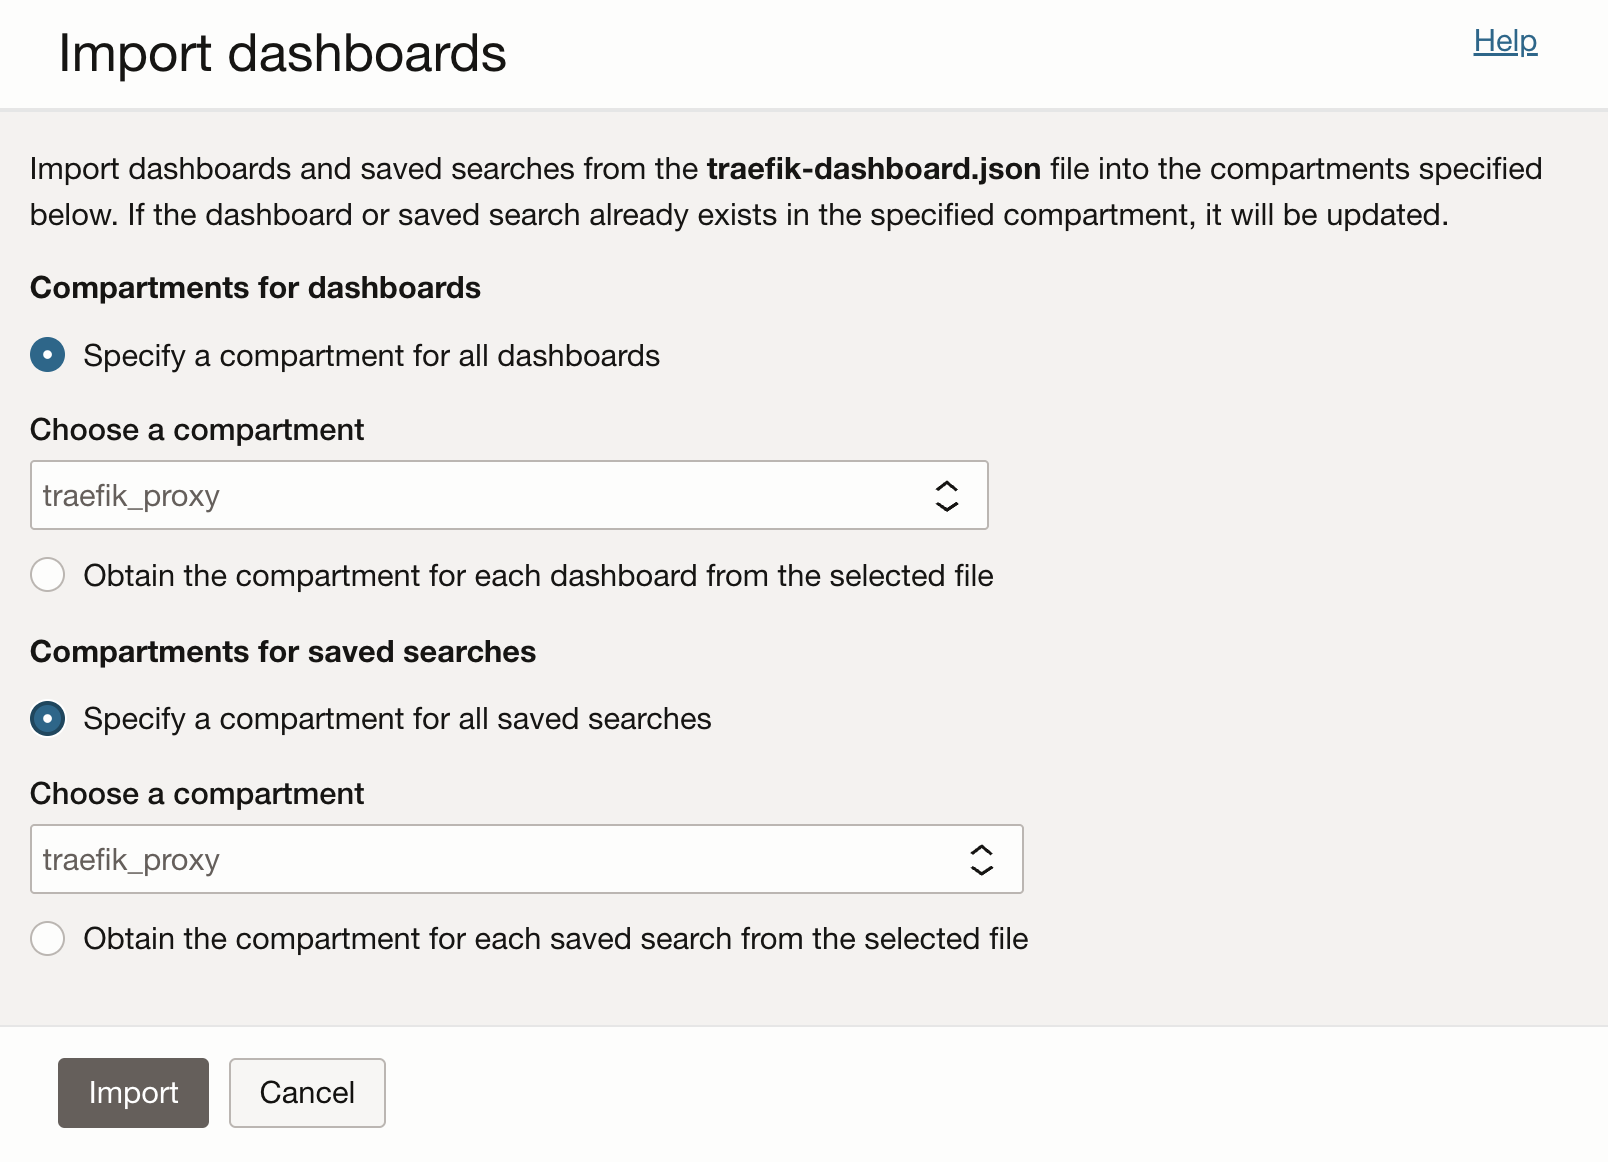
- Select Import Dashboards
- Upload the Traefik Dashboard configuration file and configure the import as shown in the image below:
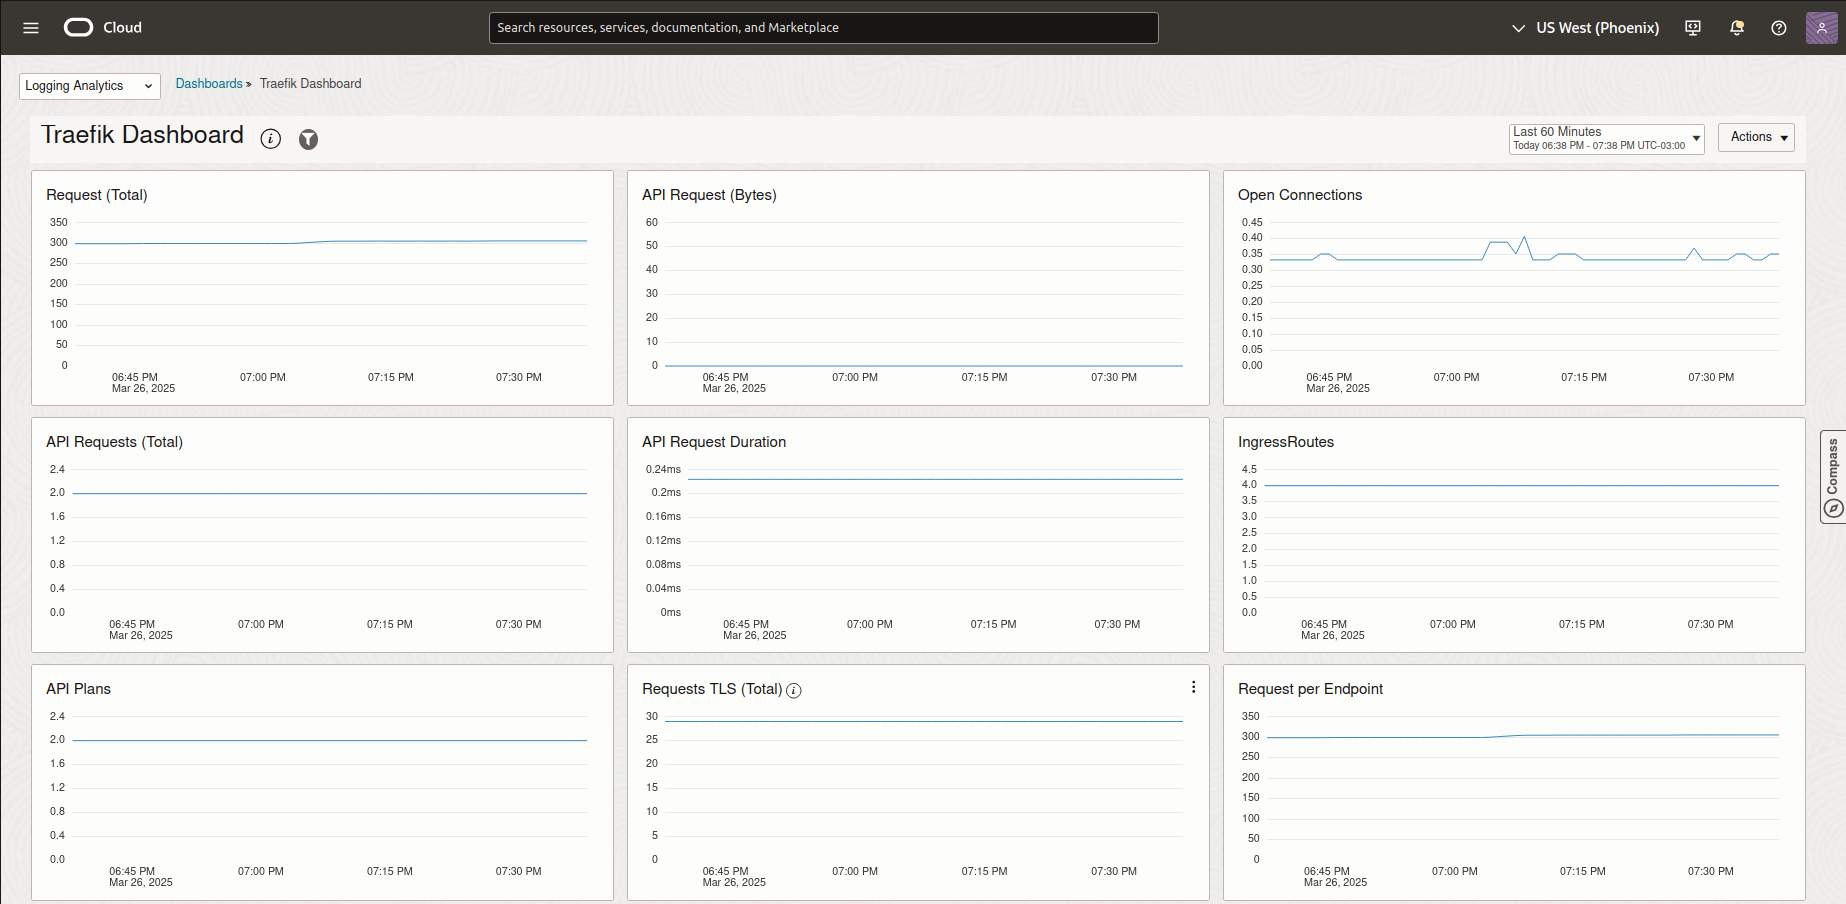
- After uploading, you should see this dashboard:
info
- For more information on creating custom dashboards, refer to the OCI documentation.
- You can customize any imported dashboard by adding or modifying widgets to suit your specific monitoring needs.
Verifying Log Collection
To verify that logs are being collected:
- Navigate to Logging Analytics >> Log Explorer
- Select your compartment
- Search for logs from the "Traefik - Access Logs - v2" source
- You should see recent log entries from your Traefik Hub deployment
Troubleshooting
If you don't see logs being collected:
- Verify the annotation is correctly applied to the Traefik pods:
kubectl describe pod -n traefik -l app.kubernetes.io/name=traefik
- Verify the Logging Analytics service is correctly configured in your tenancy
Next Steps
With the logging analytics in place, you can:
- Set up alerts based on log patterns
- Configure log retention policies
- Create custom log queries for specific troubleshooting scenarios
- Integrate with other OCI monitoring services
That's it! You have successfully configured OCI Logging Analytics for Traefik Hub.
